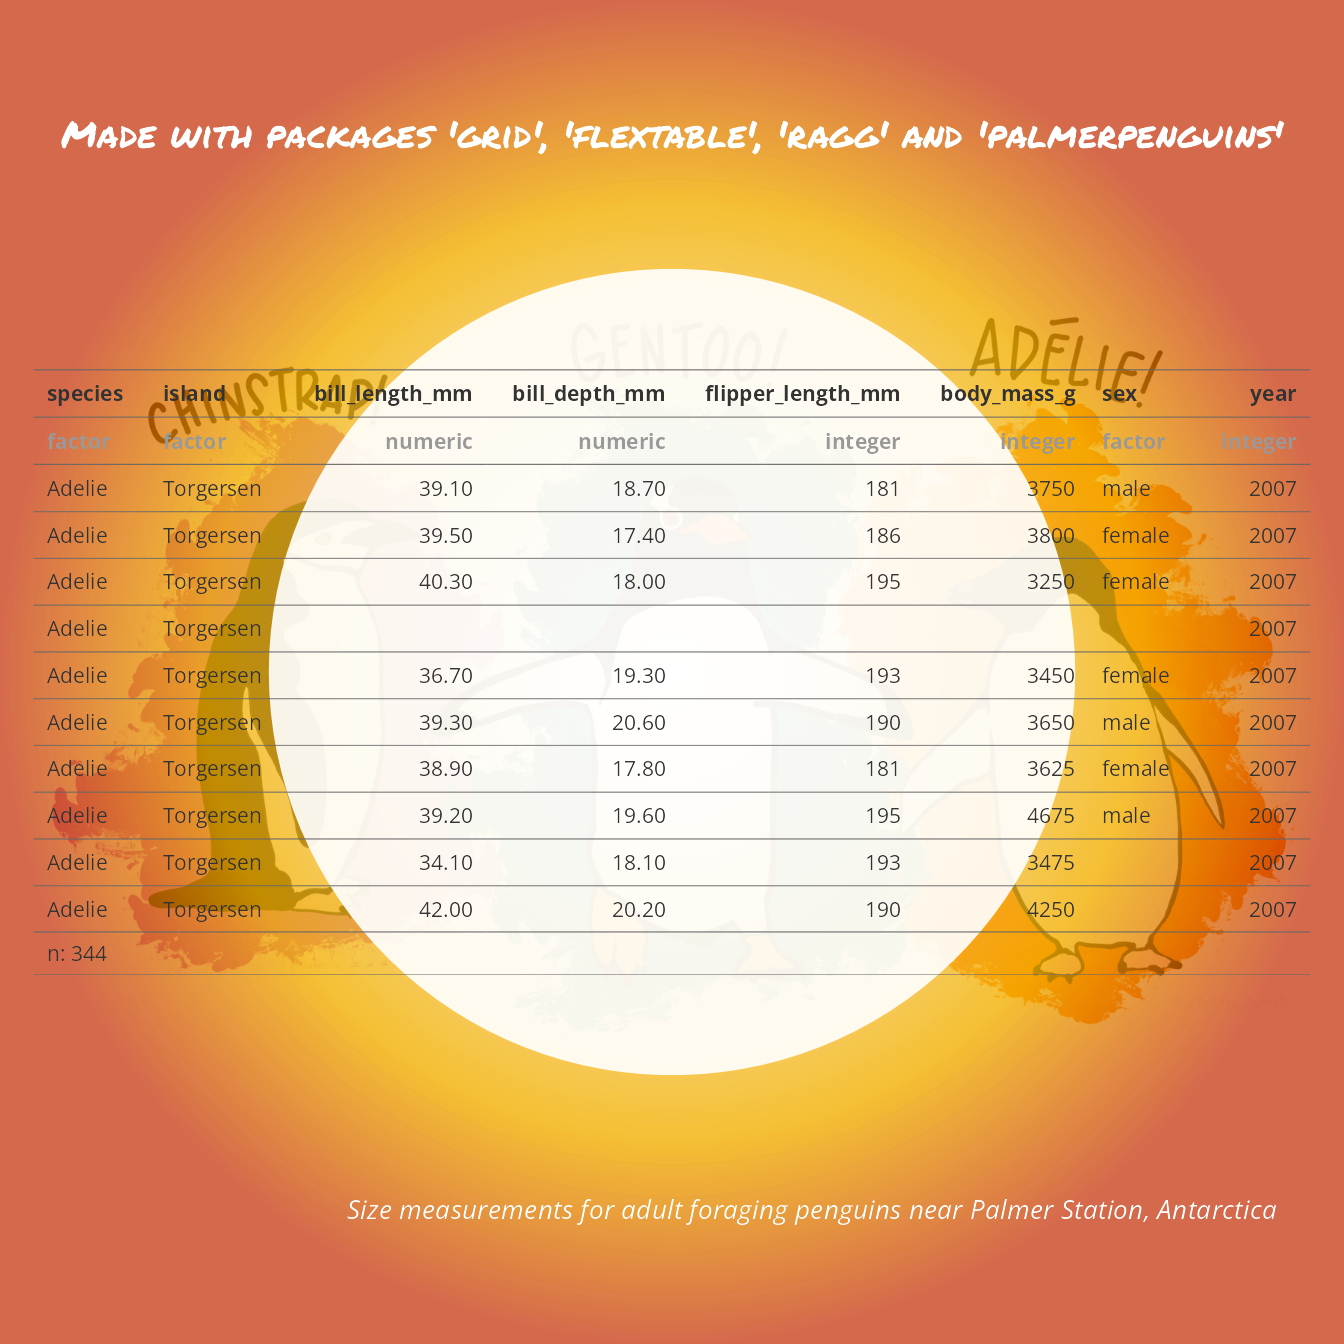
grid clipping and flextable An exemple that shows how to transform a flextable into a nice data-visualisation. grid
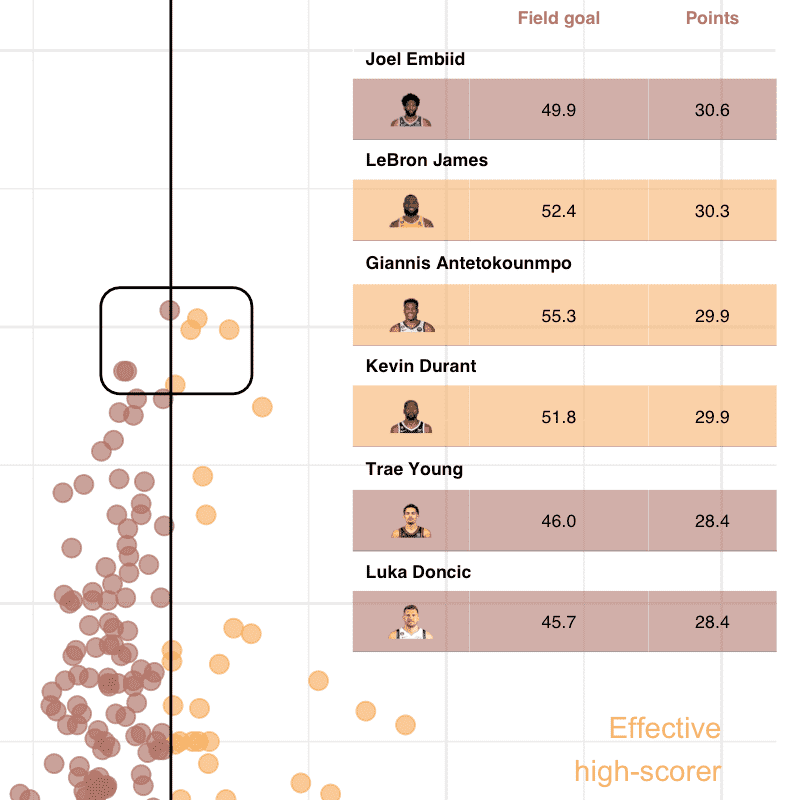
Using flextable with ggplot2 and patchwork Examples that show how to use flextable::gen_grob() and package ‘patchwork’ to mix graphics and tables. grid ggplot2
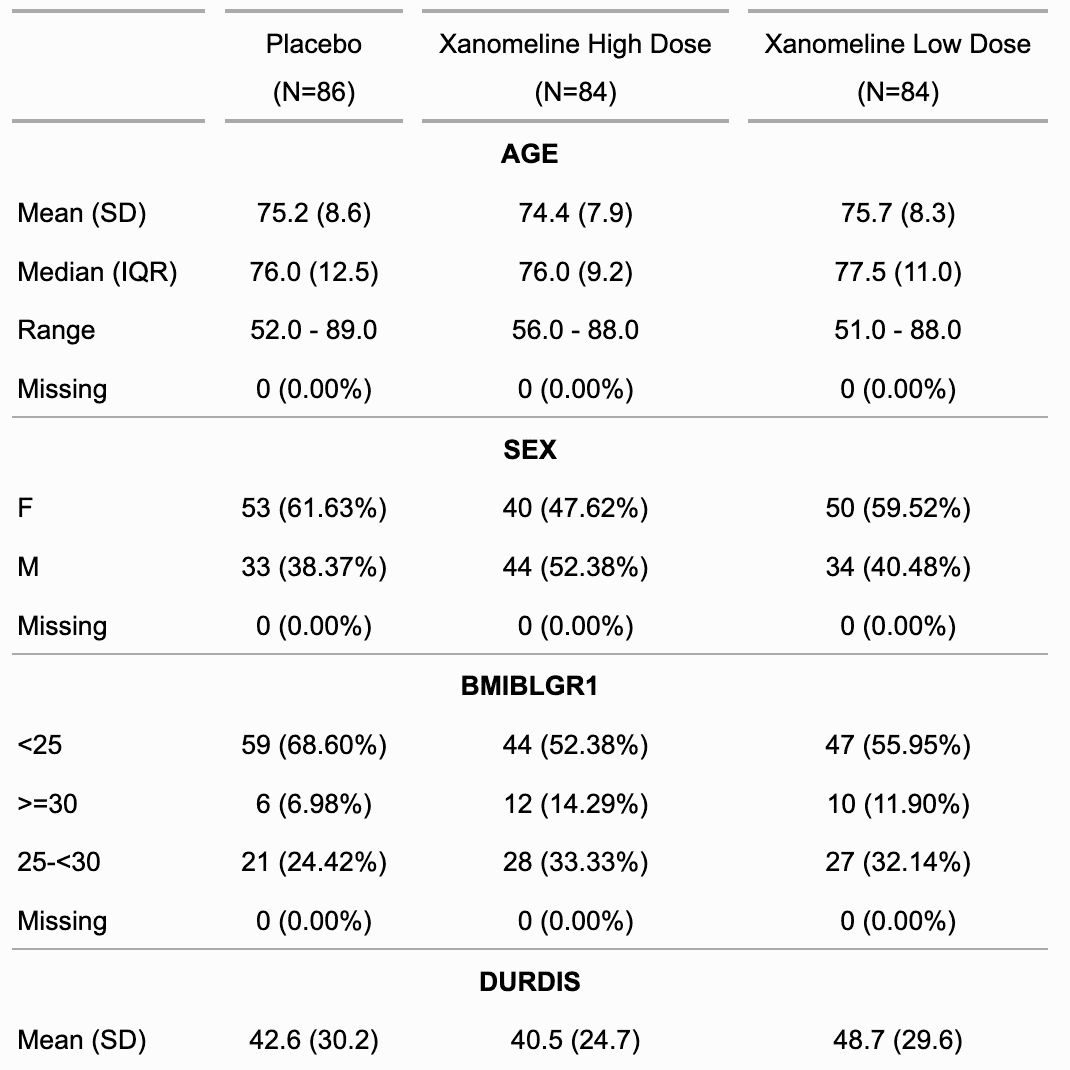
Demographic Tables with flextable This example shows how to use flextable to produce demographic tables using summarizor(). pharma tabulator summarizor caption
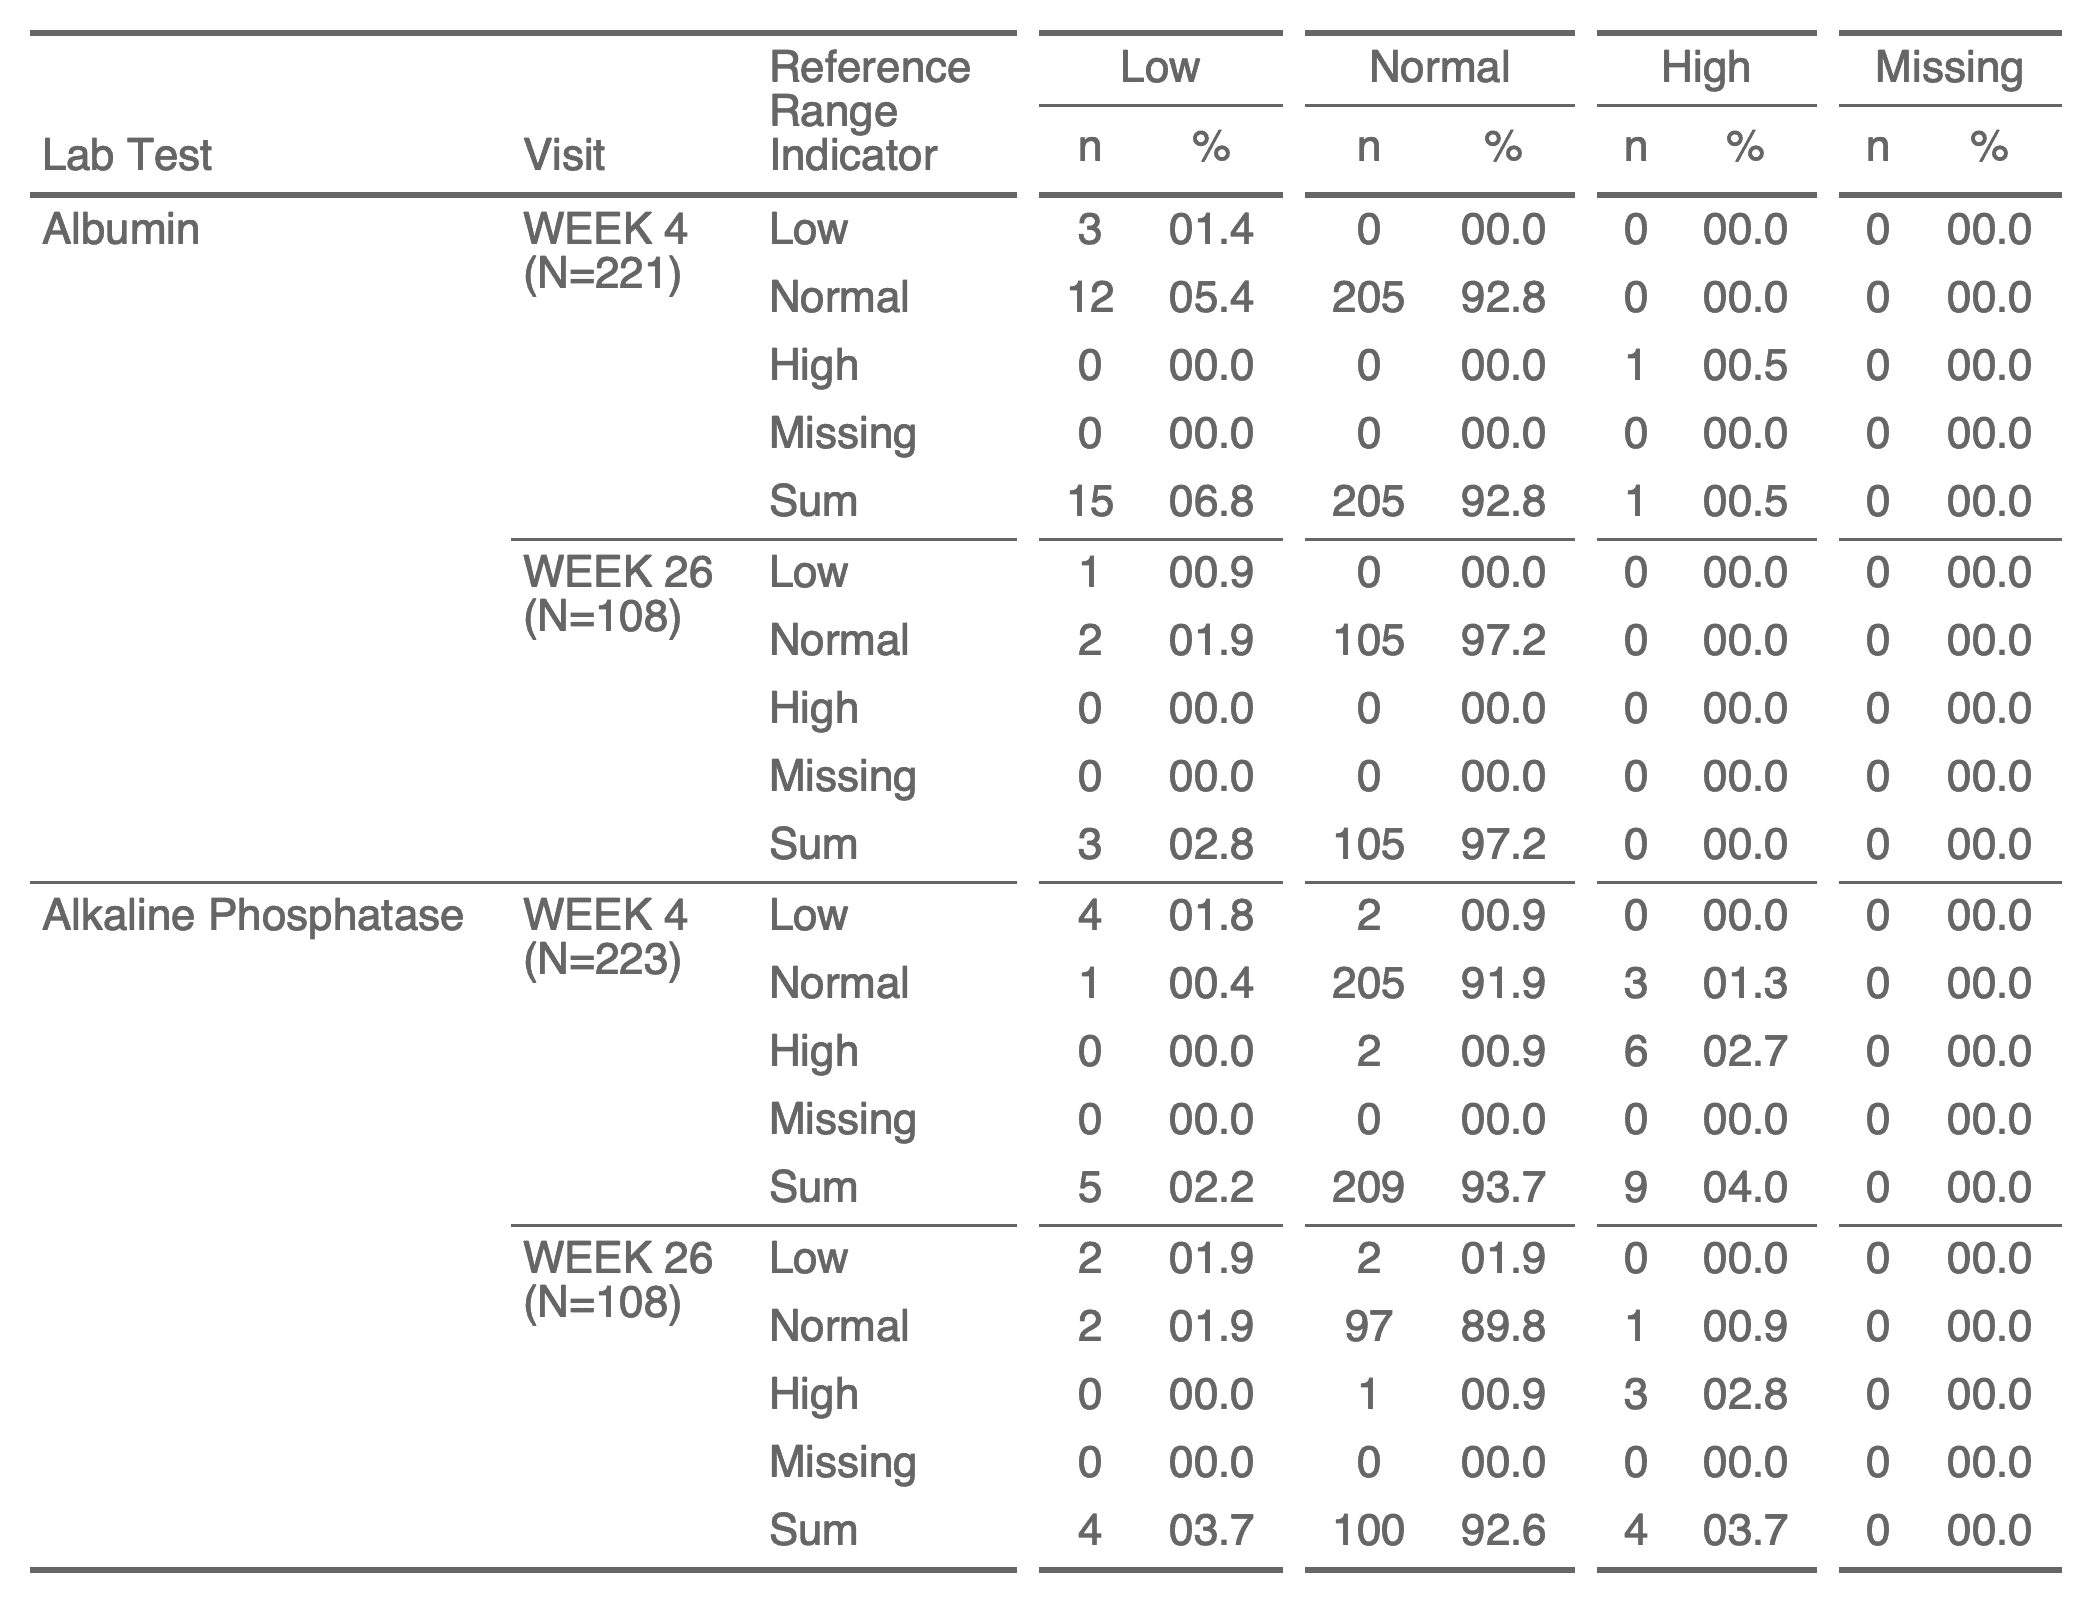
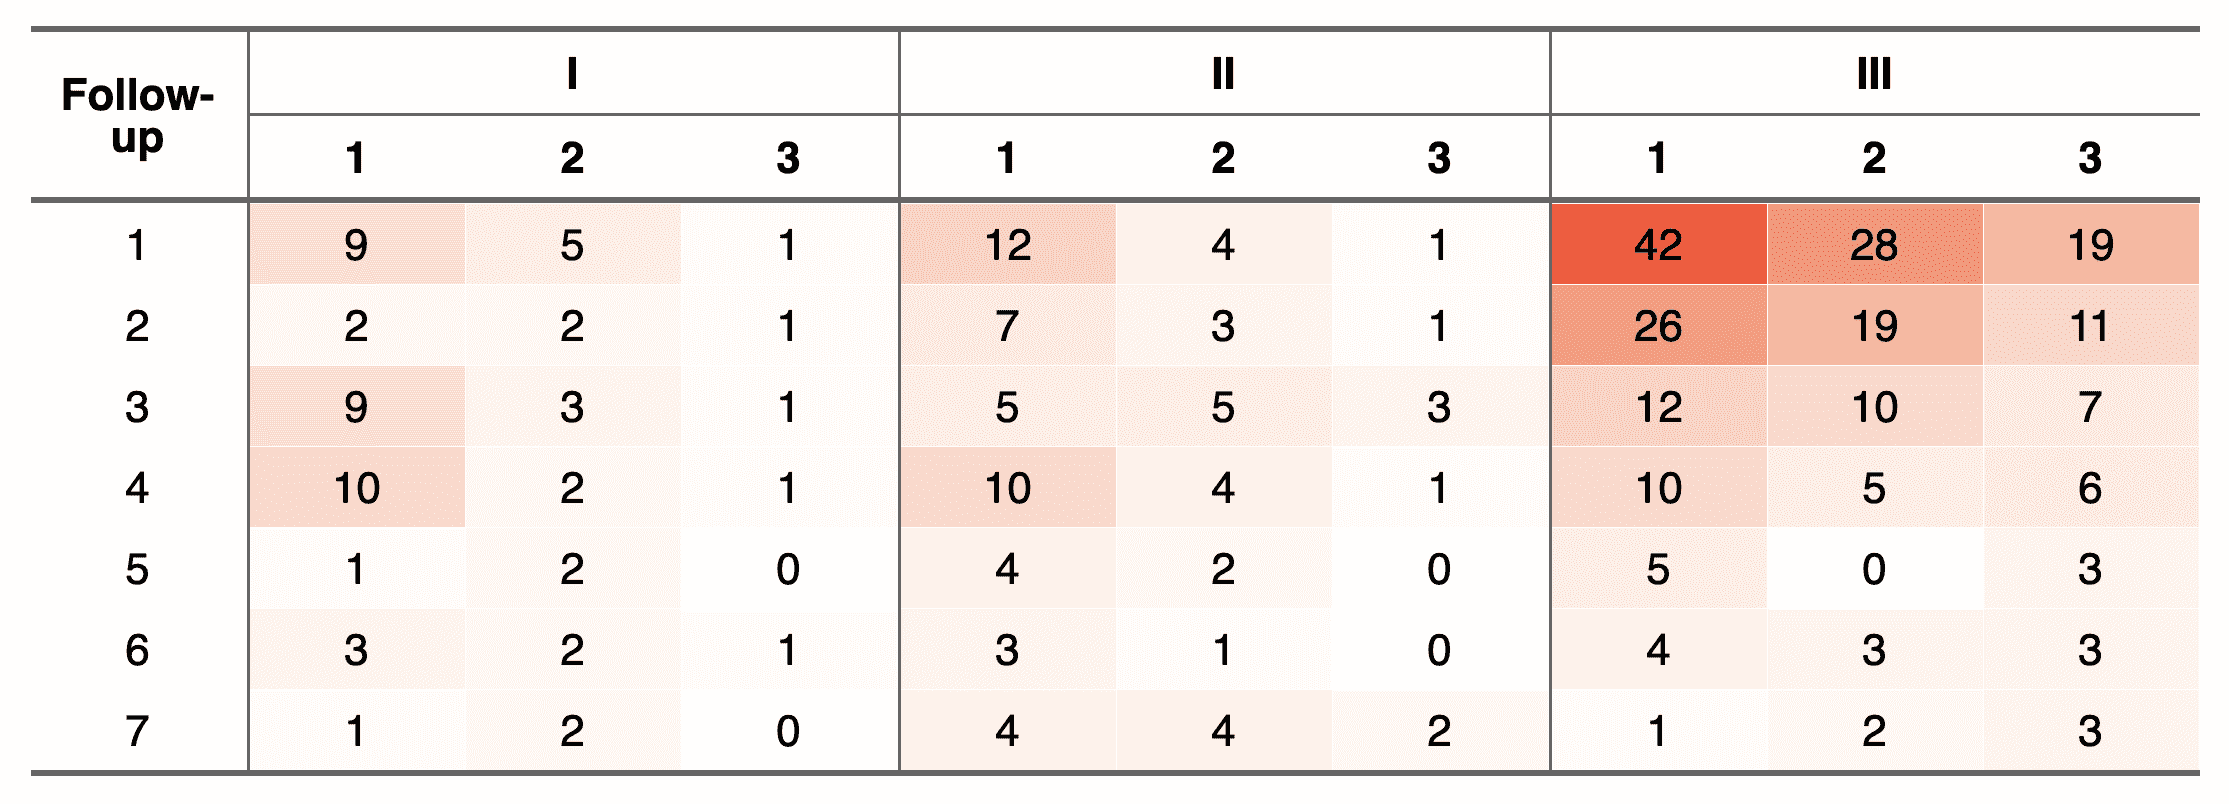
Shift Tables with flextable This example show how to use flextable to produce shift tables by using shift_table() and flextable::tabulator(). pharma tabulator
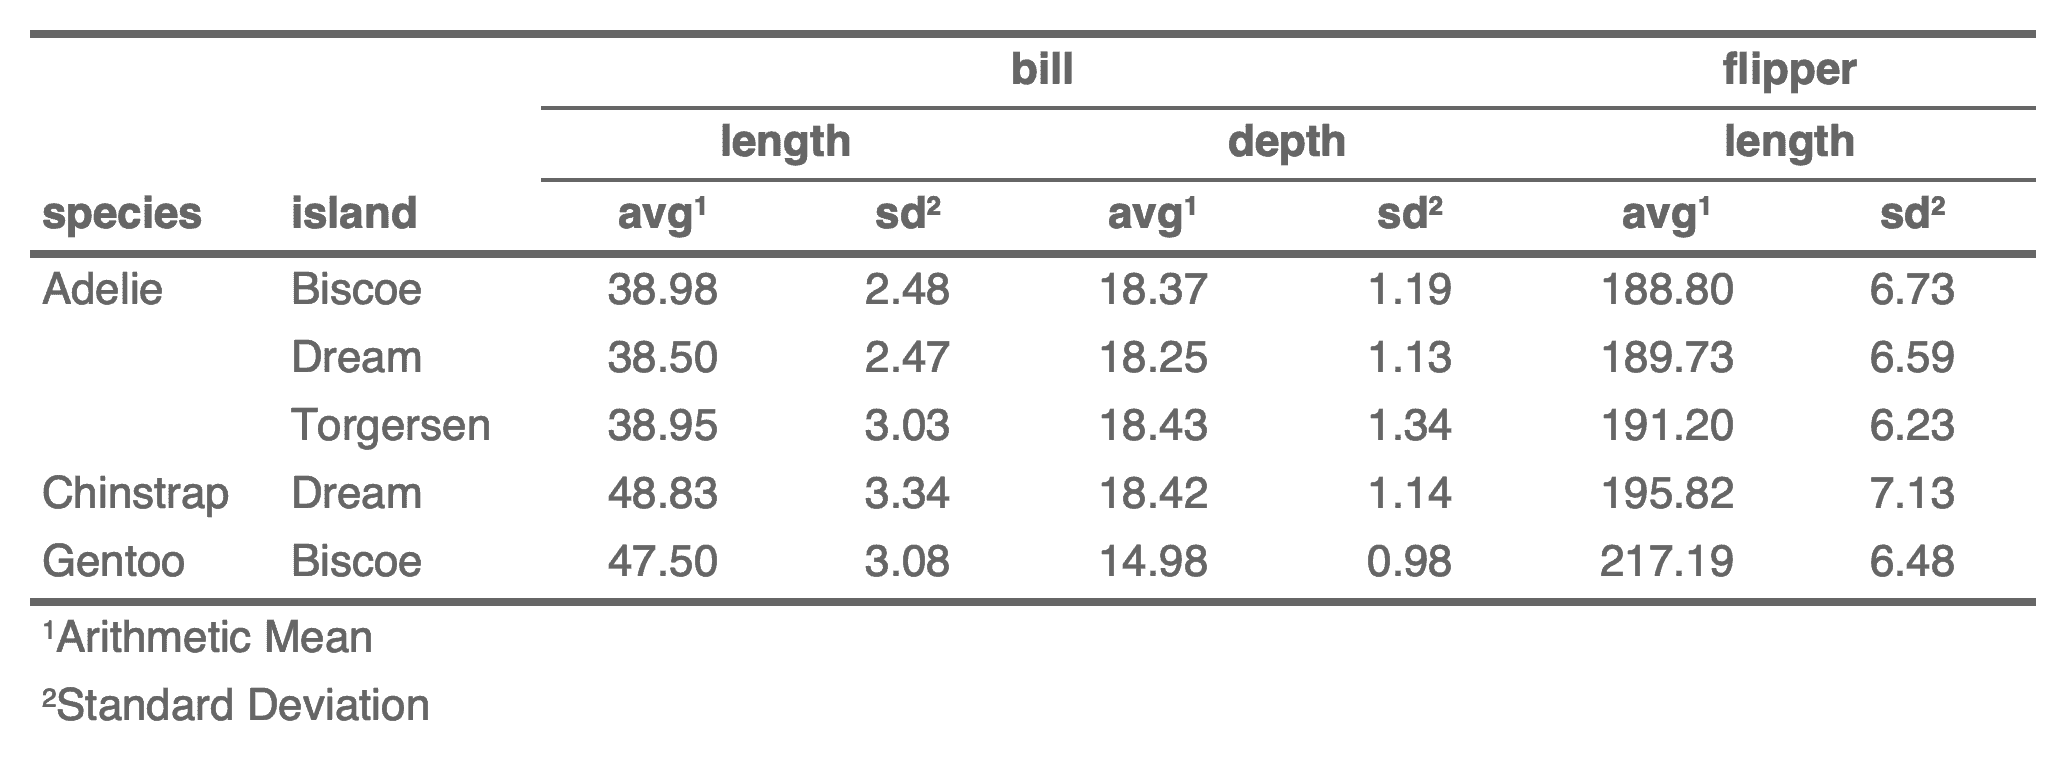
Separate column names in header This example show how to separate collapsed colnames into multiple rows with a dataset produced by dplyr::summarise(). headers
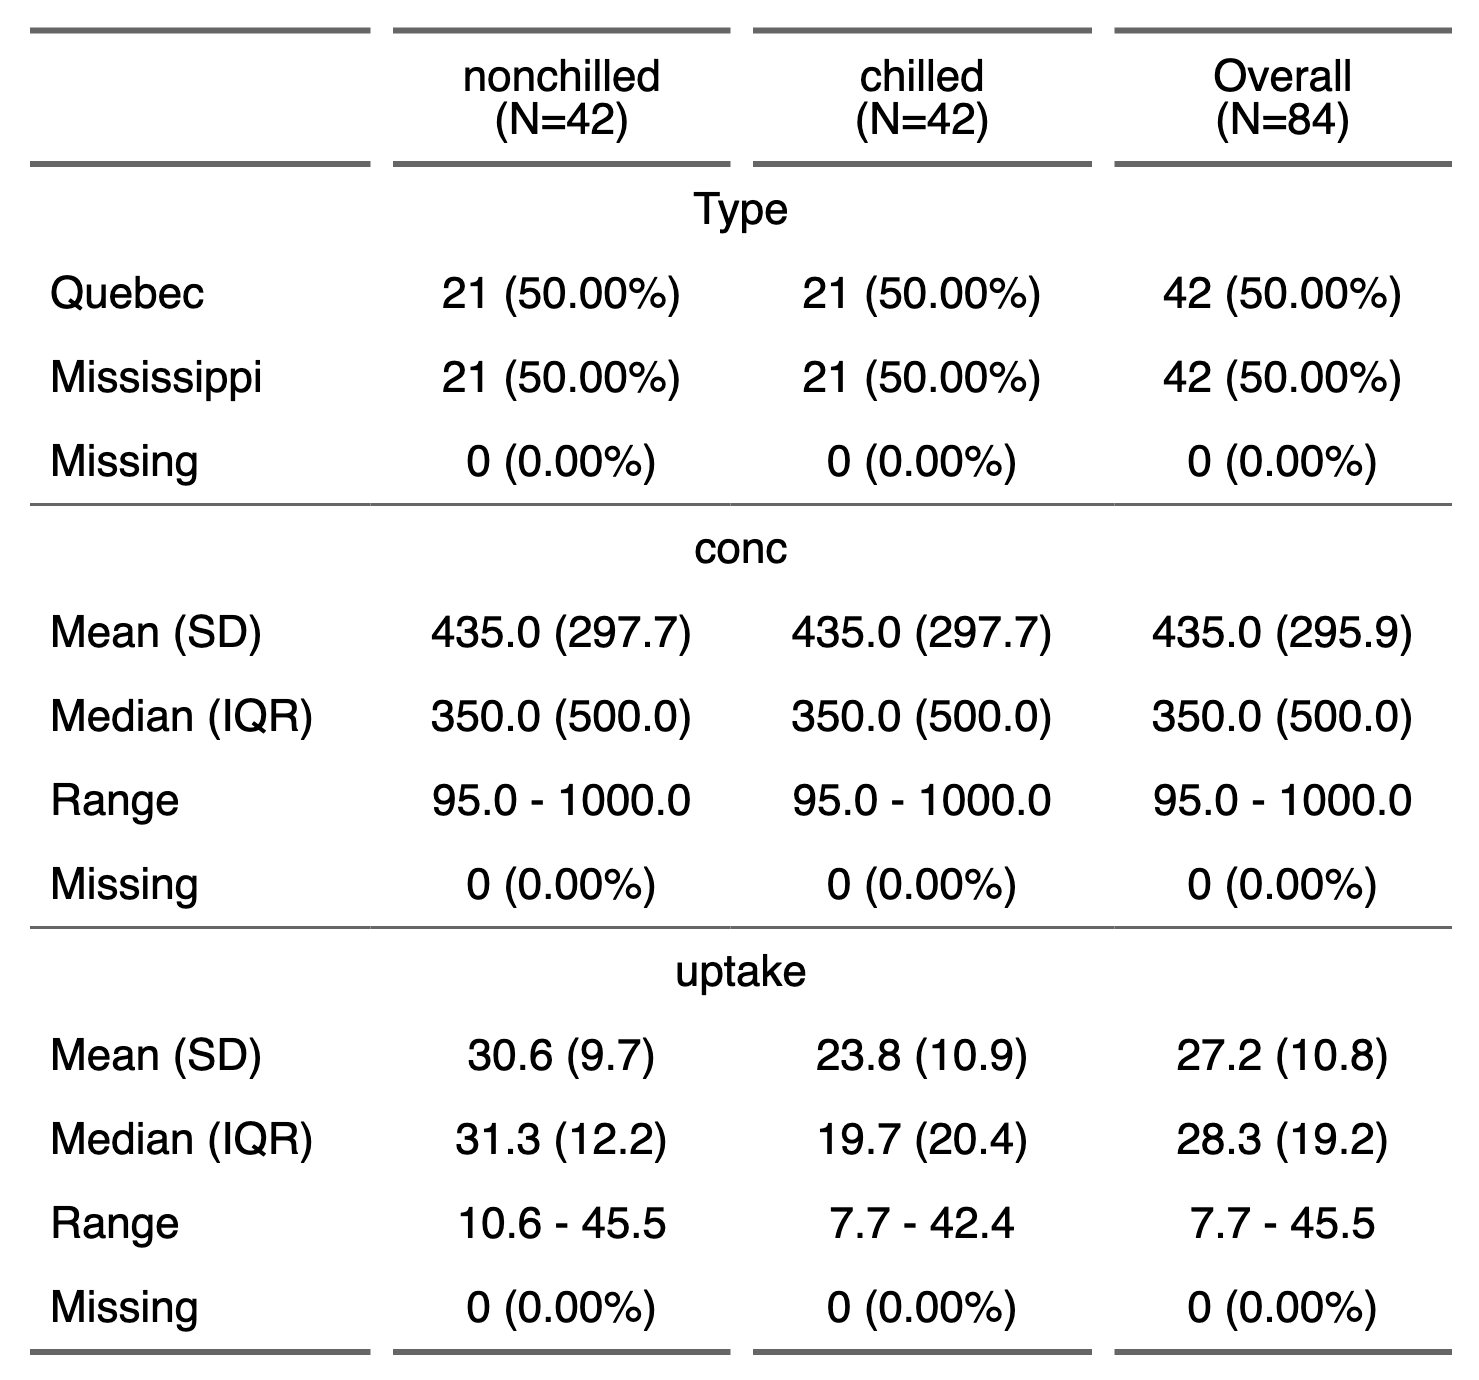
Dataset summary with summarizor This example show how to create a table presenting statistical summary of the columns of a data.frame with function summarizor(). as_flextable
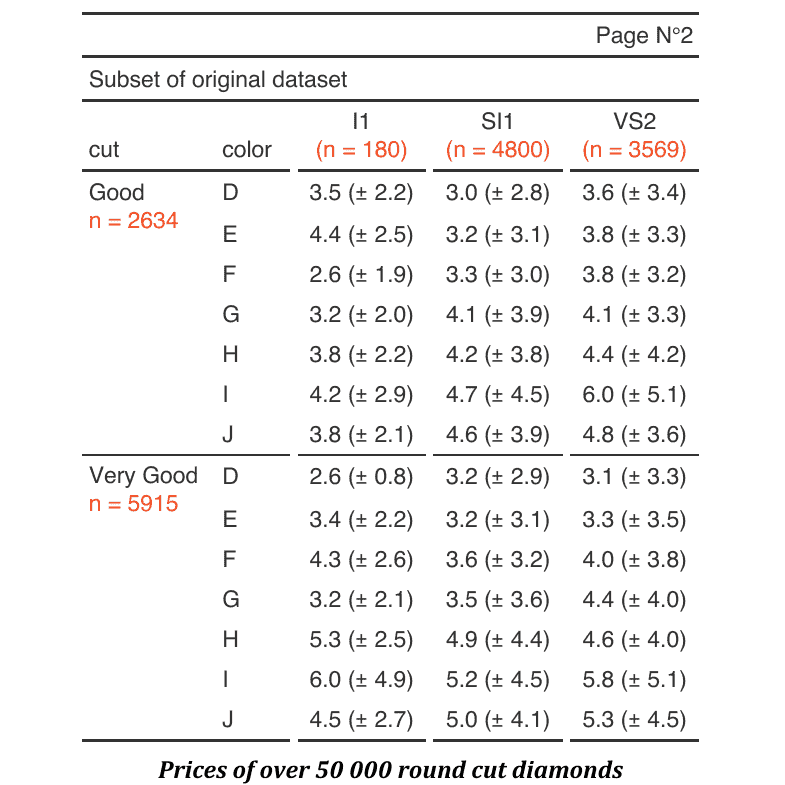
Nice cross-tabulated flextable How to create a nice cross-tabulated flextable from aggregations. This example demonstrate how to use function tabulator(). as_flextable tabulator settings
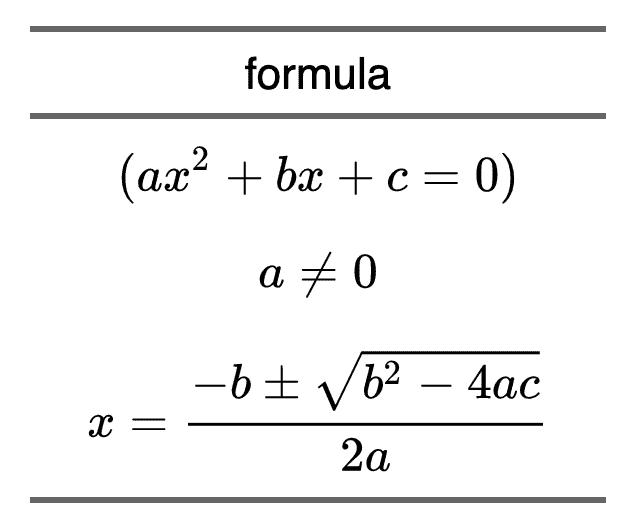
Columns names with Katex This example shows how to create a flextable equations in header by using LaTeX equations. cell-content compose
Insert equations This example shows how to add ‘Latex’ equations into a flextable. cell-content compose
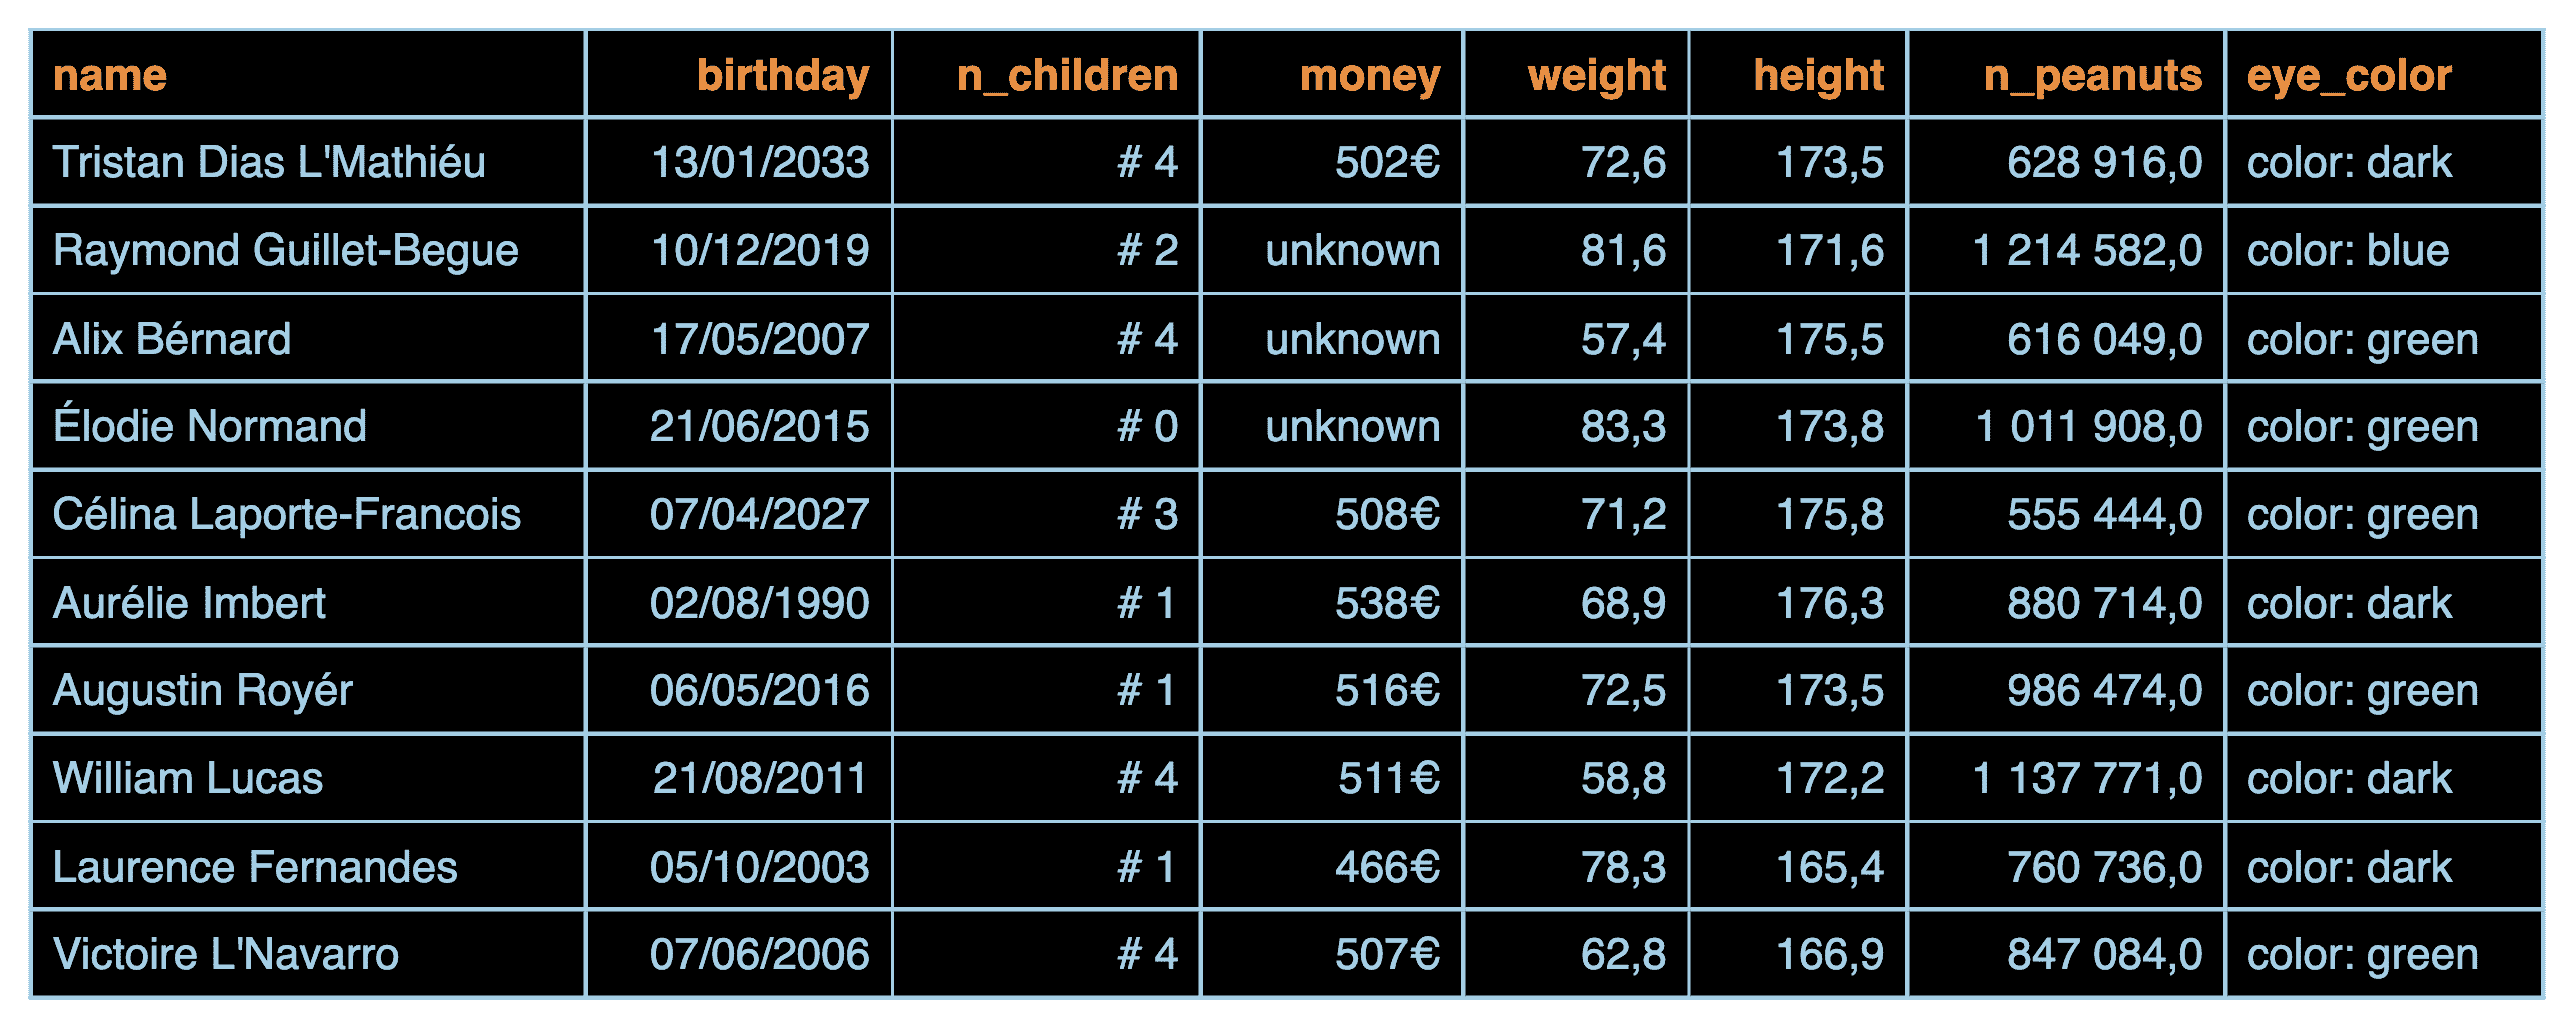
Define how the text is displayed Demonstration of formatting capabilities for cell content of various types such as numeric columns, dates, strings. cell-content settings
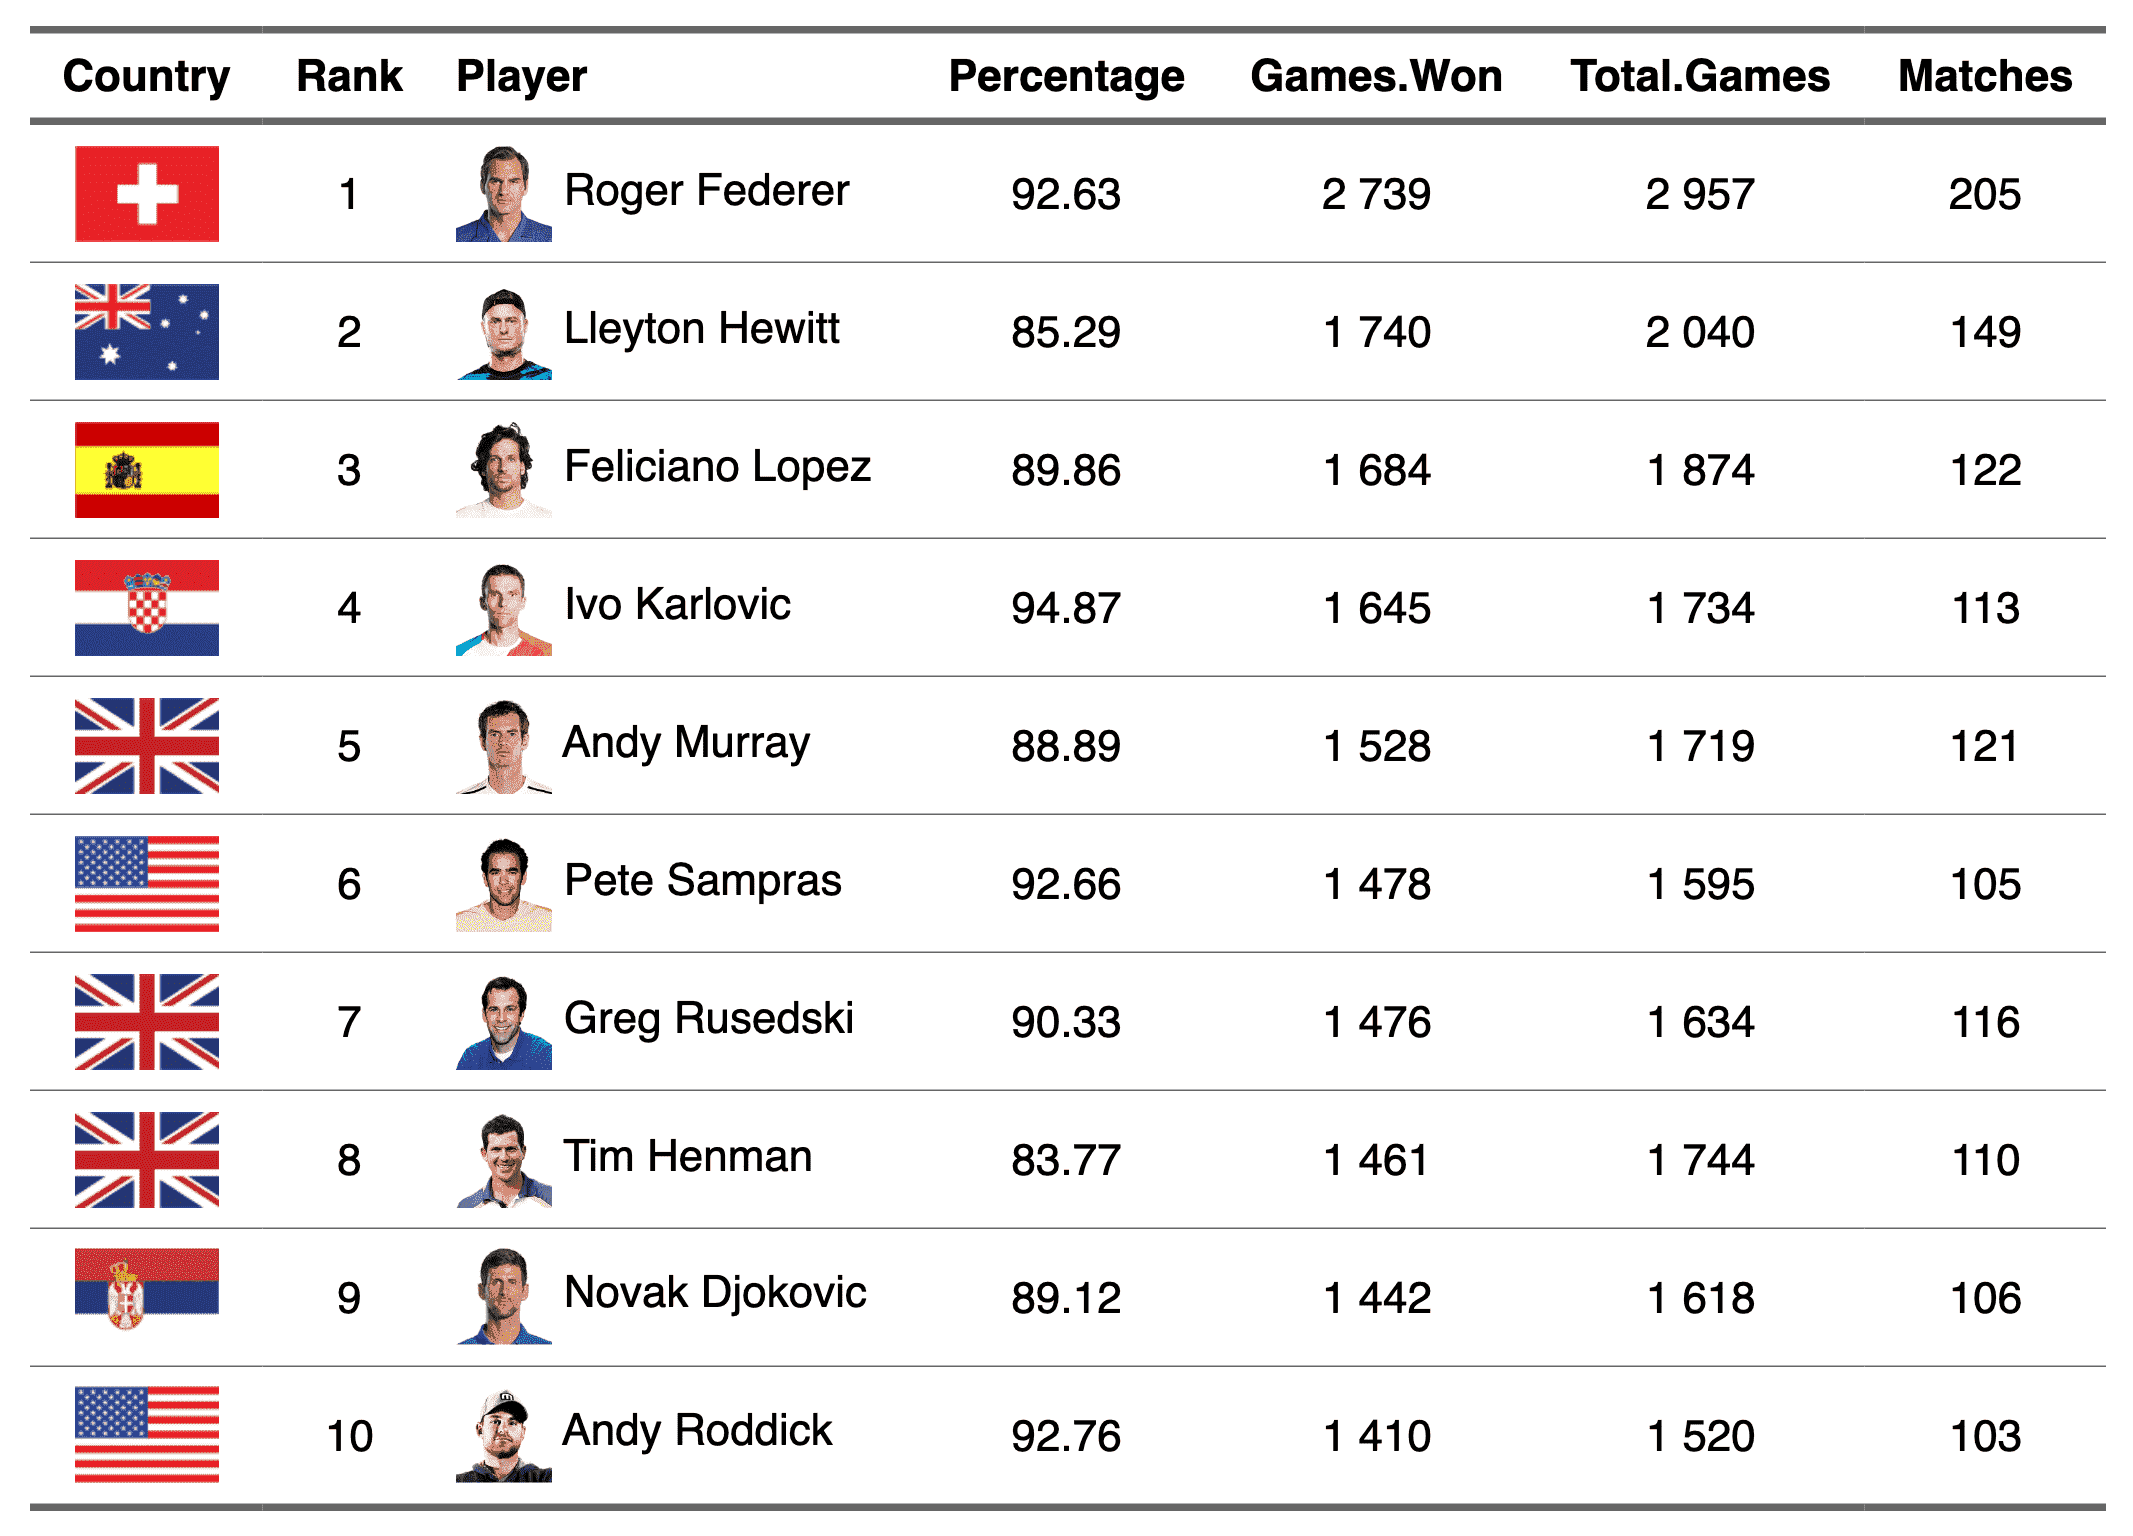
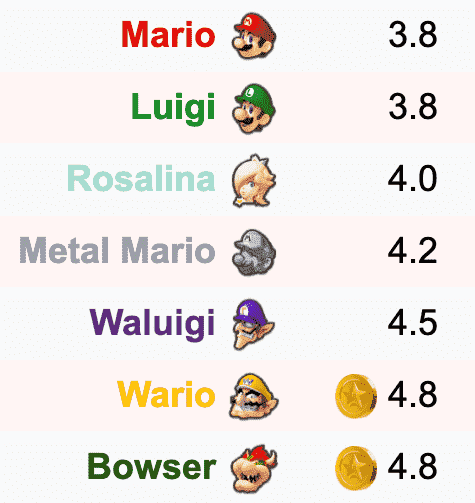
Ranking of tennis players Mix text and images inside a flextable with the functions compose and as_image. compose image
captions examples How to add captions to a flextable in R Markdown documents. These examples demonstrate various methods. caption as_flextable
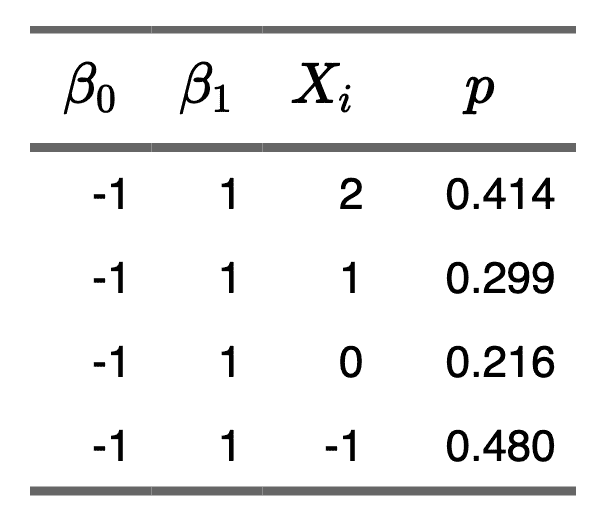
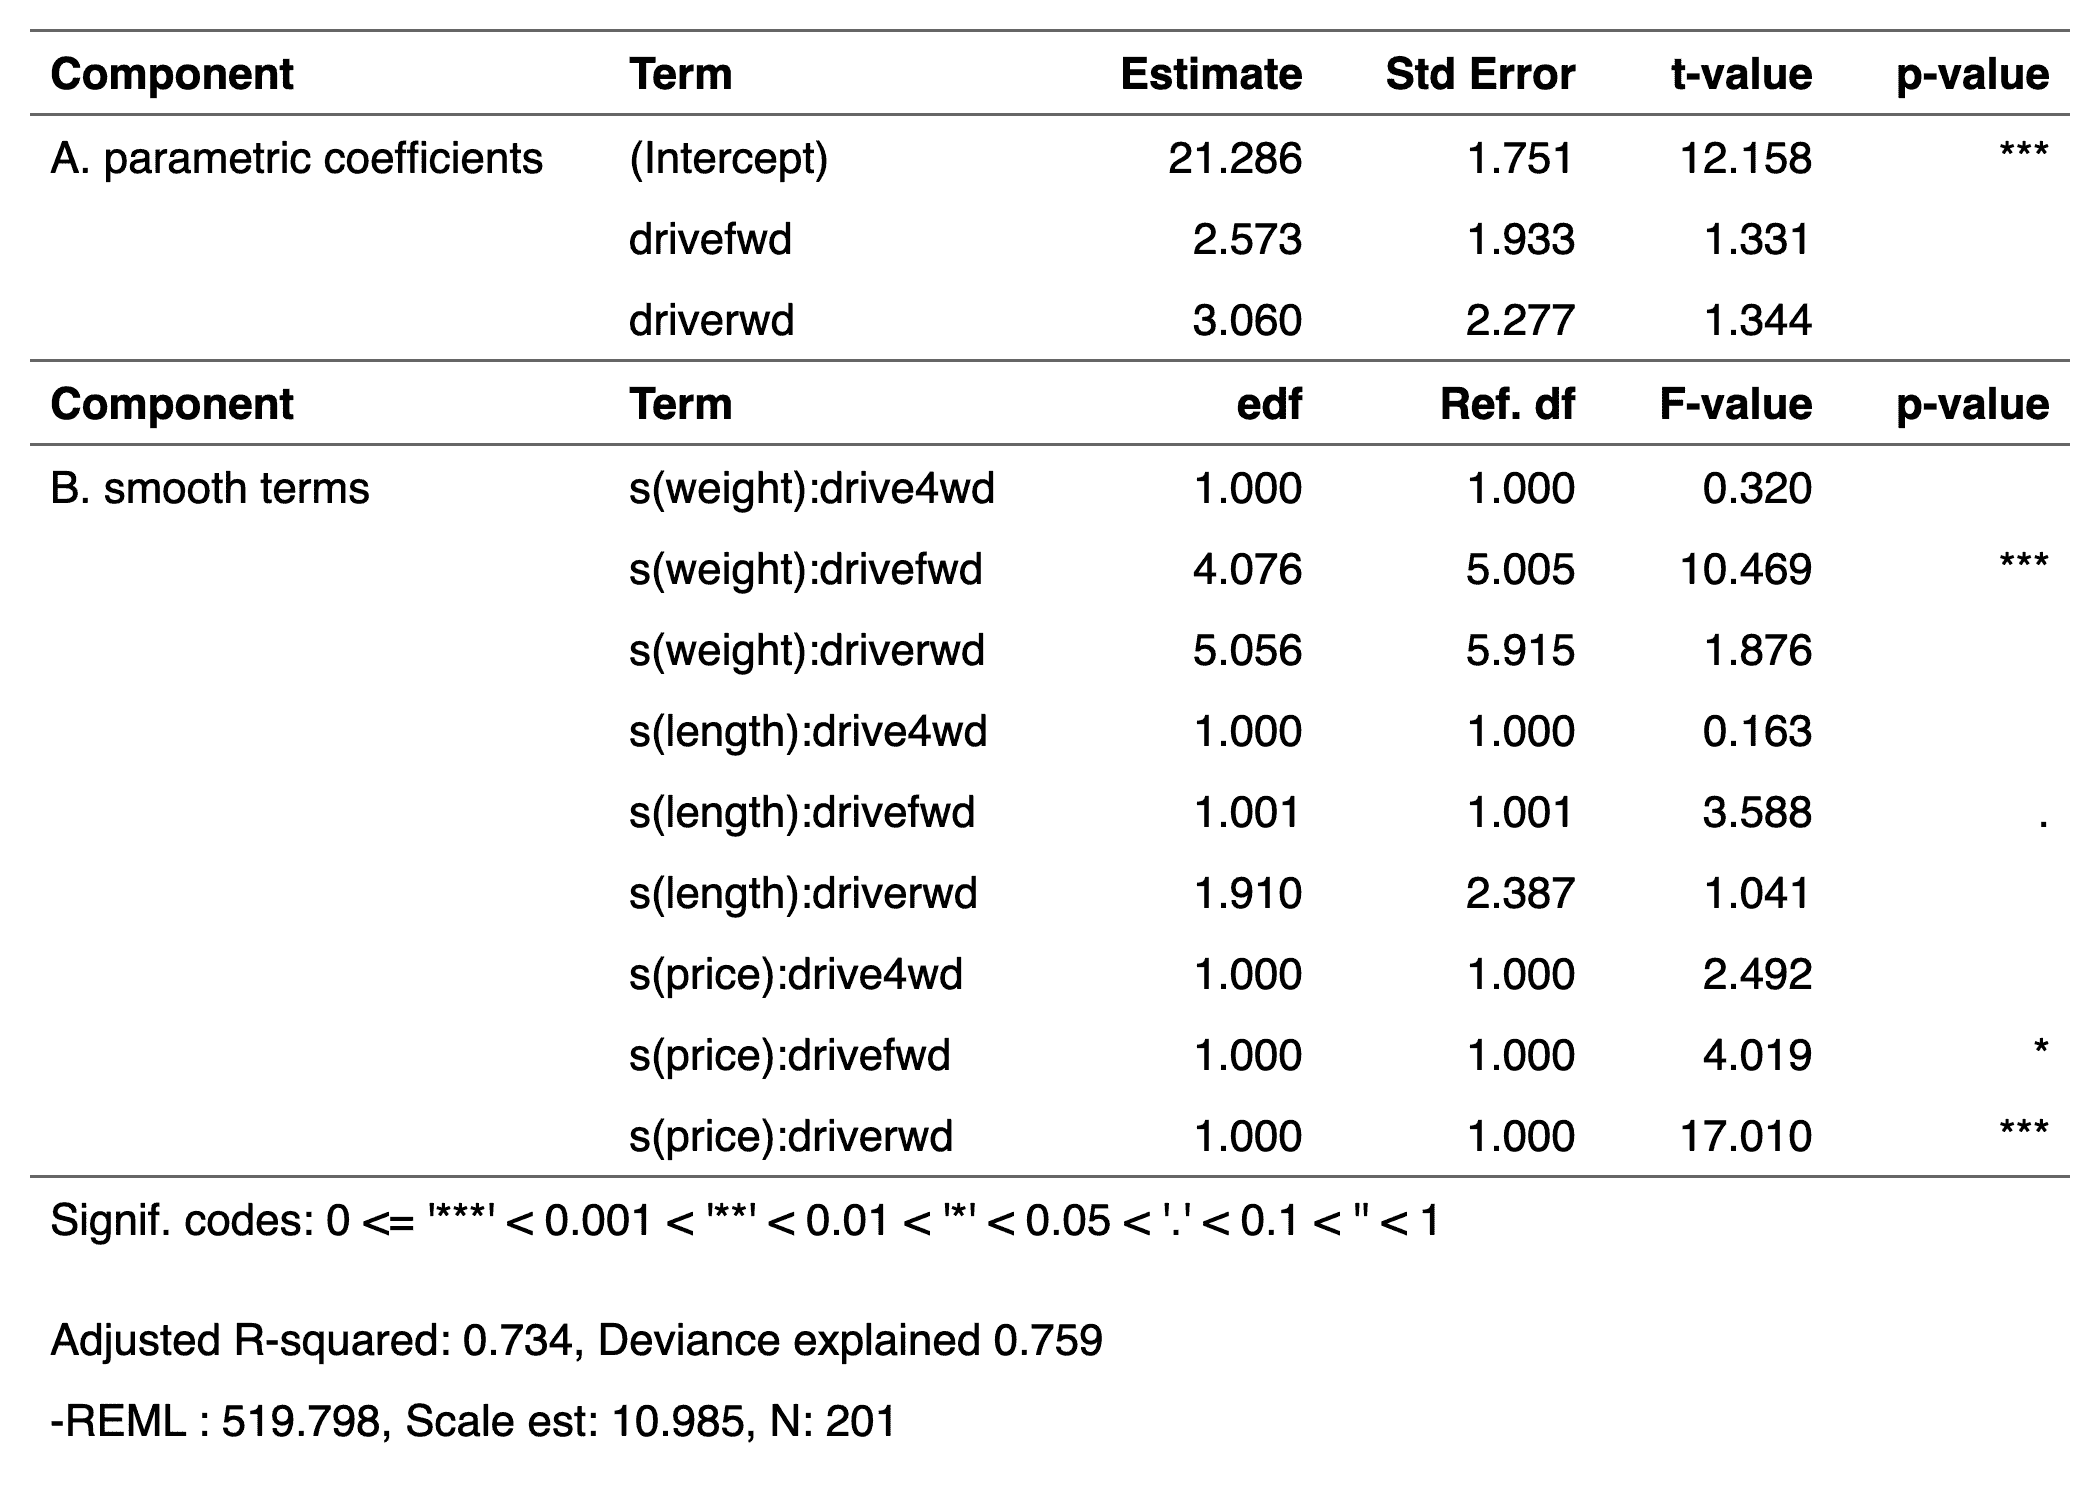
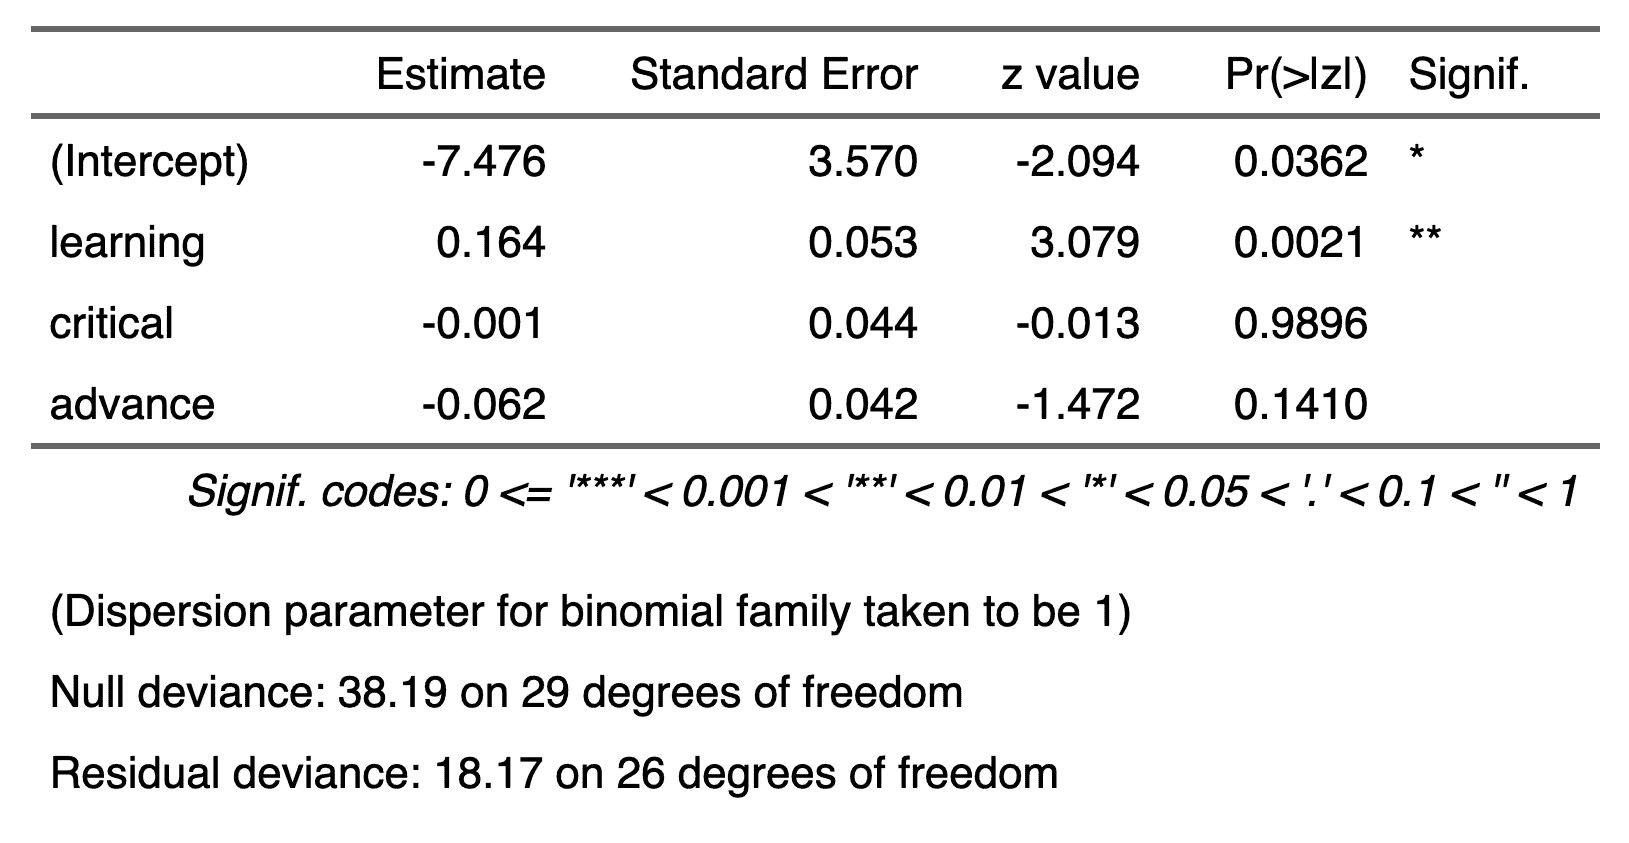
GLM model This example illustrates the creation of a flextable from a GLM model with a simple call to as_flextable. model as_flextable
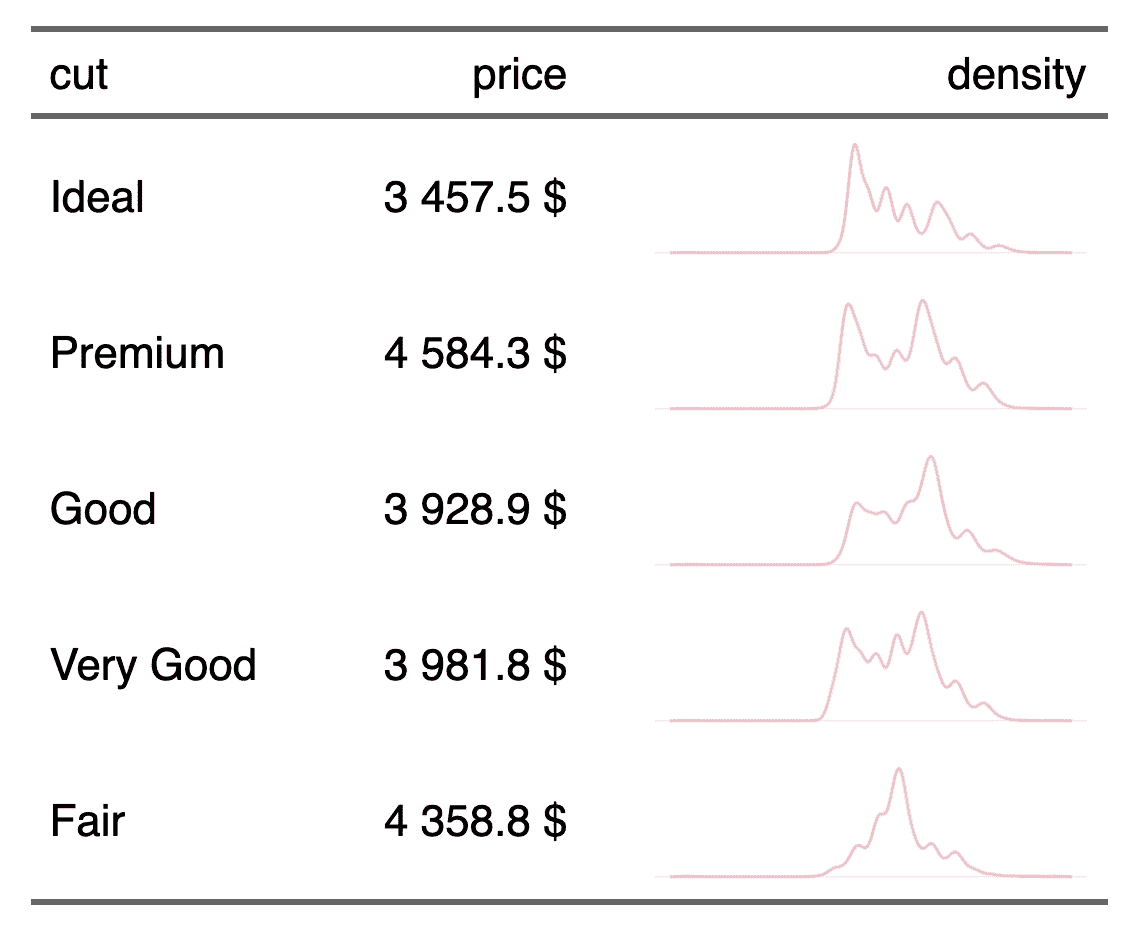
Table with density lines In this example, we create a flextable that represents aggregations and density curves together. compose plot
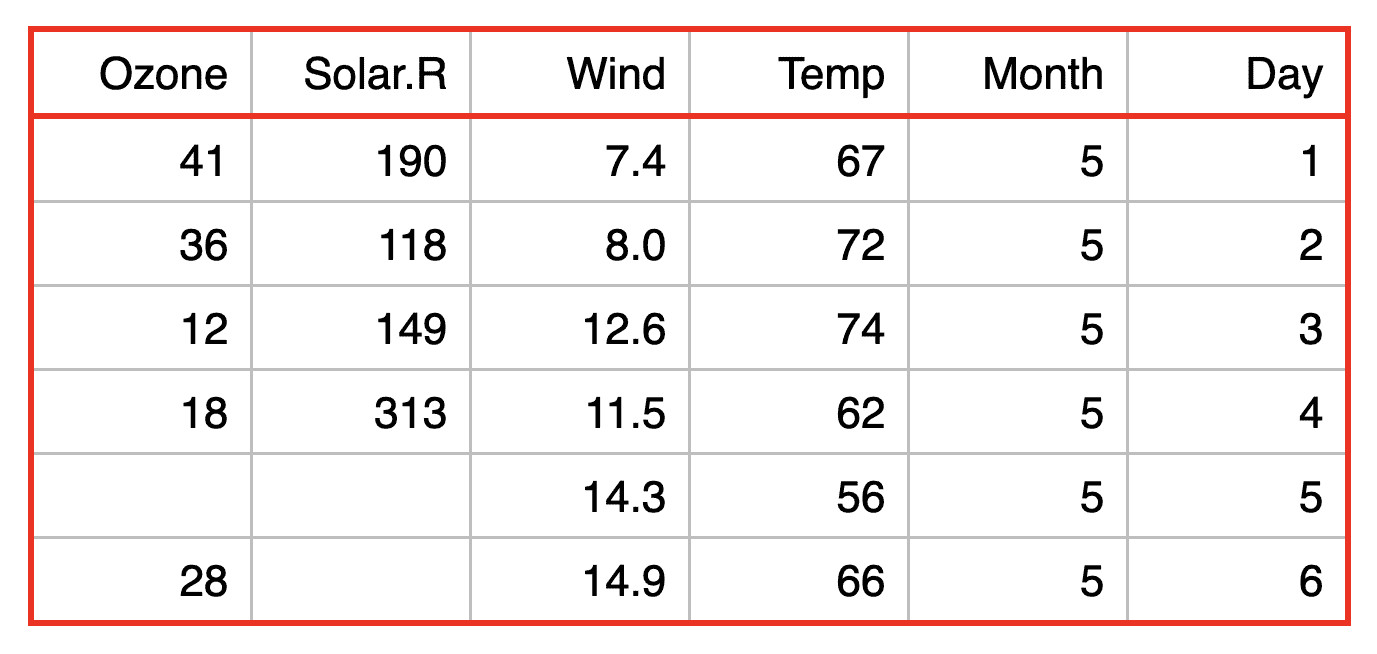
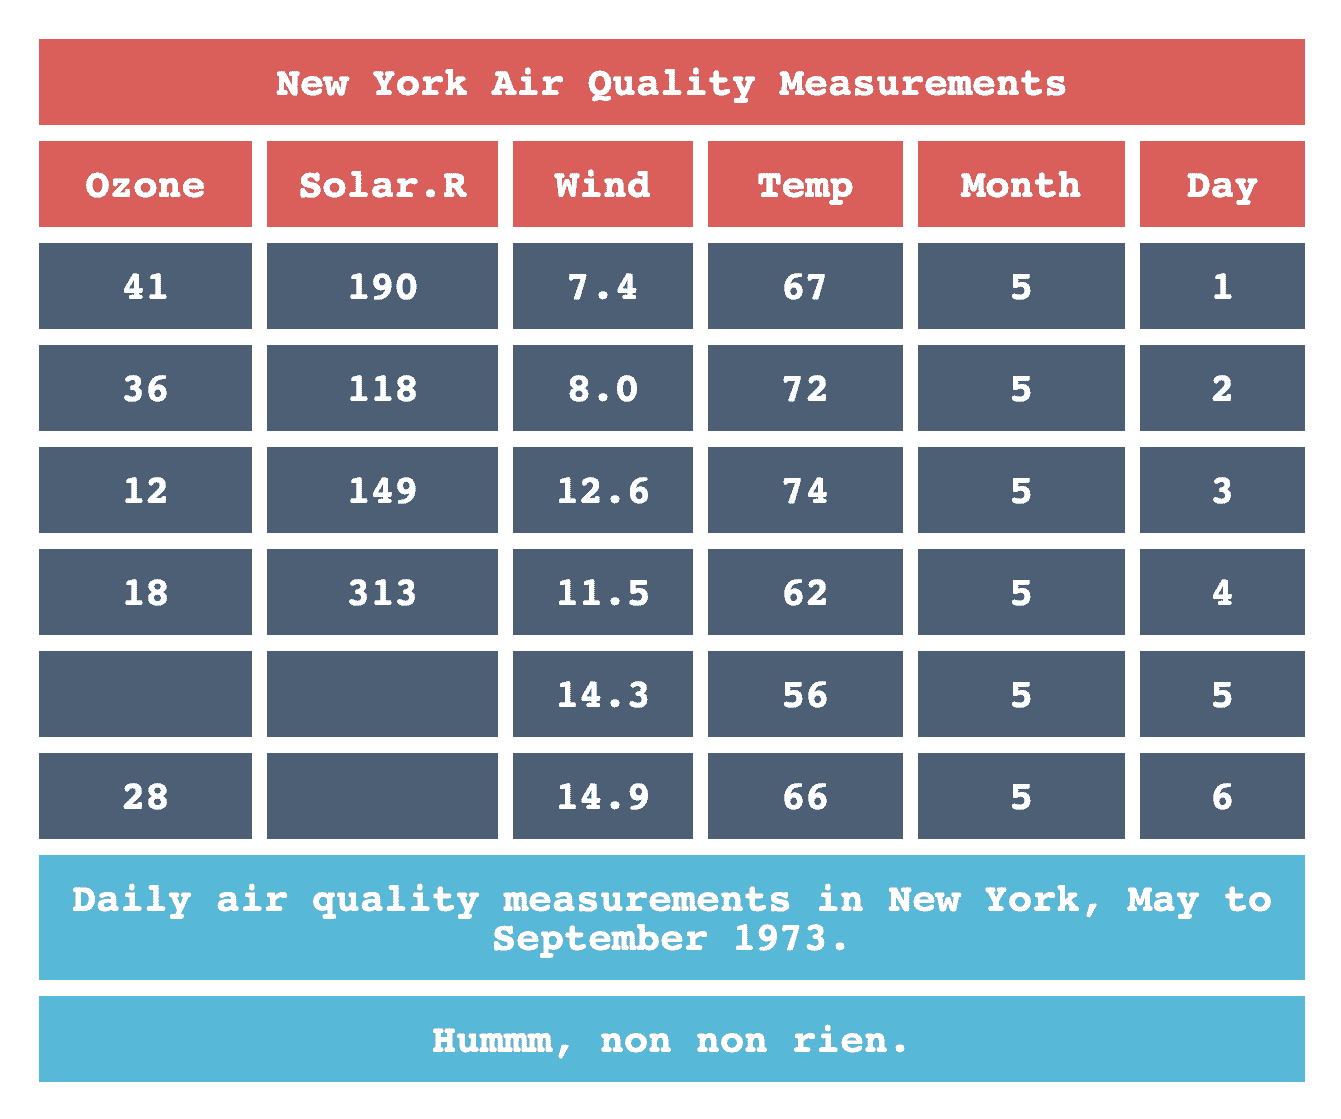
Creating a theme function In this example, a theme function is created and used to format different data.frame. theme