gradient-colored-table
The packages
library(flextable)
library(magrittr)
library(data.table)
library(scales)
The data
The data are as follows:
cancer_data <- fread("Cancer.dat")
cancers <- dcast(cancer_data, formula = time ~ histology + stage,
                         fill = 0, value.var = "count", fun.aggregate = sum)
cancers
## time 1_1 1_2 1_3 2_1 2_2 2_3 3_1 3_2 3_3
## 1: 1 9 12 42 5 4 28 1 1 19
## 2: 2 2 7 26 2 3 19 1 1 11
## 3: 3 9 5 12 3 5 10 1 3 7
## 4: 4 10 10 10 2 4 5 1 1 6
## 5: 5 1 4 5 2 2 0 0 0 3
## 6: 6 3 3 4 2 1 3 1 0 3
## 7: 7 1 4 1 2 4 2 0 2 3Labels associated with column names are presented below :
cancers_header <- data.frame(
  col_keys = c("time", "1_1", "2_1", "3_1",
               "1_2", "2_2", "3_2",
               "1_3", "2_3","3_3"),
  line2 = c("Follow-up", rep("I", 3), rep("II", 3), rep("III", 3)),
  line3 = c("Follow-up", rep(c("1", "2", "3"), 3))
)
cancers_header
## col_keys line2 line3
## 1 time Follow-up Follow-up
## 2 1_1 I 1
## 3 2_1 I 2
## 4 3_1 I 3
## 5 1_2 II 1
## 6 2_2 II 2
## 7 3_2 II 3
## 8 1_3 III 1
## 9 2_3 III 2
## 10 3_3 III 3Preparation of the coloring function
The package ‘scales’ allows to create functions for coloring which can be used with ‘ggplot2’ but also with other packages like ‘flextable’.
colourer <- col_numeric(
  palette = c("transparent", "red"),
  domain = c(0, 50))
The default flextable
ft <- flextable( cancers, col_keys = cancers_header$col_keys)
fttime | 1_1 | 2_1 | 3_1 | 1_2 | 2_2 | 3_2 | 1_3 | 2_3 | 3_3 |
1 | 9 | 5 | 1 | 12 | 4 | 1 | 42 | 28 | 19 |
2 | 2 | 2 | 1 | 7 | 3 | 1 | 26 | 19 | 11 |
3 | 9 | 3 | 1 | 5 | 5 | 3 | 12 | 10 | 7 |
4 | 10 | 2 | 1 | 10 | 4 | 1 | 10 | 5 | 6 |
5 | 1 | 2 | 0 | 4 | 2 | 0 | 5 | 0 | 3 |
6 | 3 | 2 | 1 | 3 | 1 | 0 | 4 | 3 | 3 |
7 | 1 | 2 | 0 | 4 | 4 | 2 | 1 | 2 | 3 |
The final flextable
We will add the headers, customize the table a little and
we will use the bg() function which can use our function as argument.
ft <- set_header_df( ft, mapping = cancers_header, key = "col_keys" ) %>%
  merge_v(part = "header", j = 1) %>%
  merge_h(part = "header", i = 1) %>%
  theme_booktabs(bold_header = TRUE) %>%
  align(align = "center", part = "all") %>%
  bg(
    bg = colourer,
    j = ~ . -time,
    part = "body") %>%
  vline(j = c(1, 4, 7), border = fp_border_default())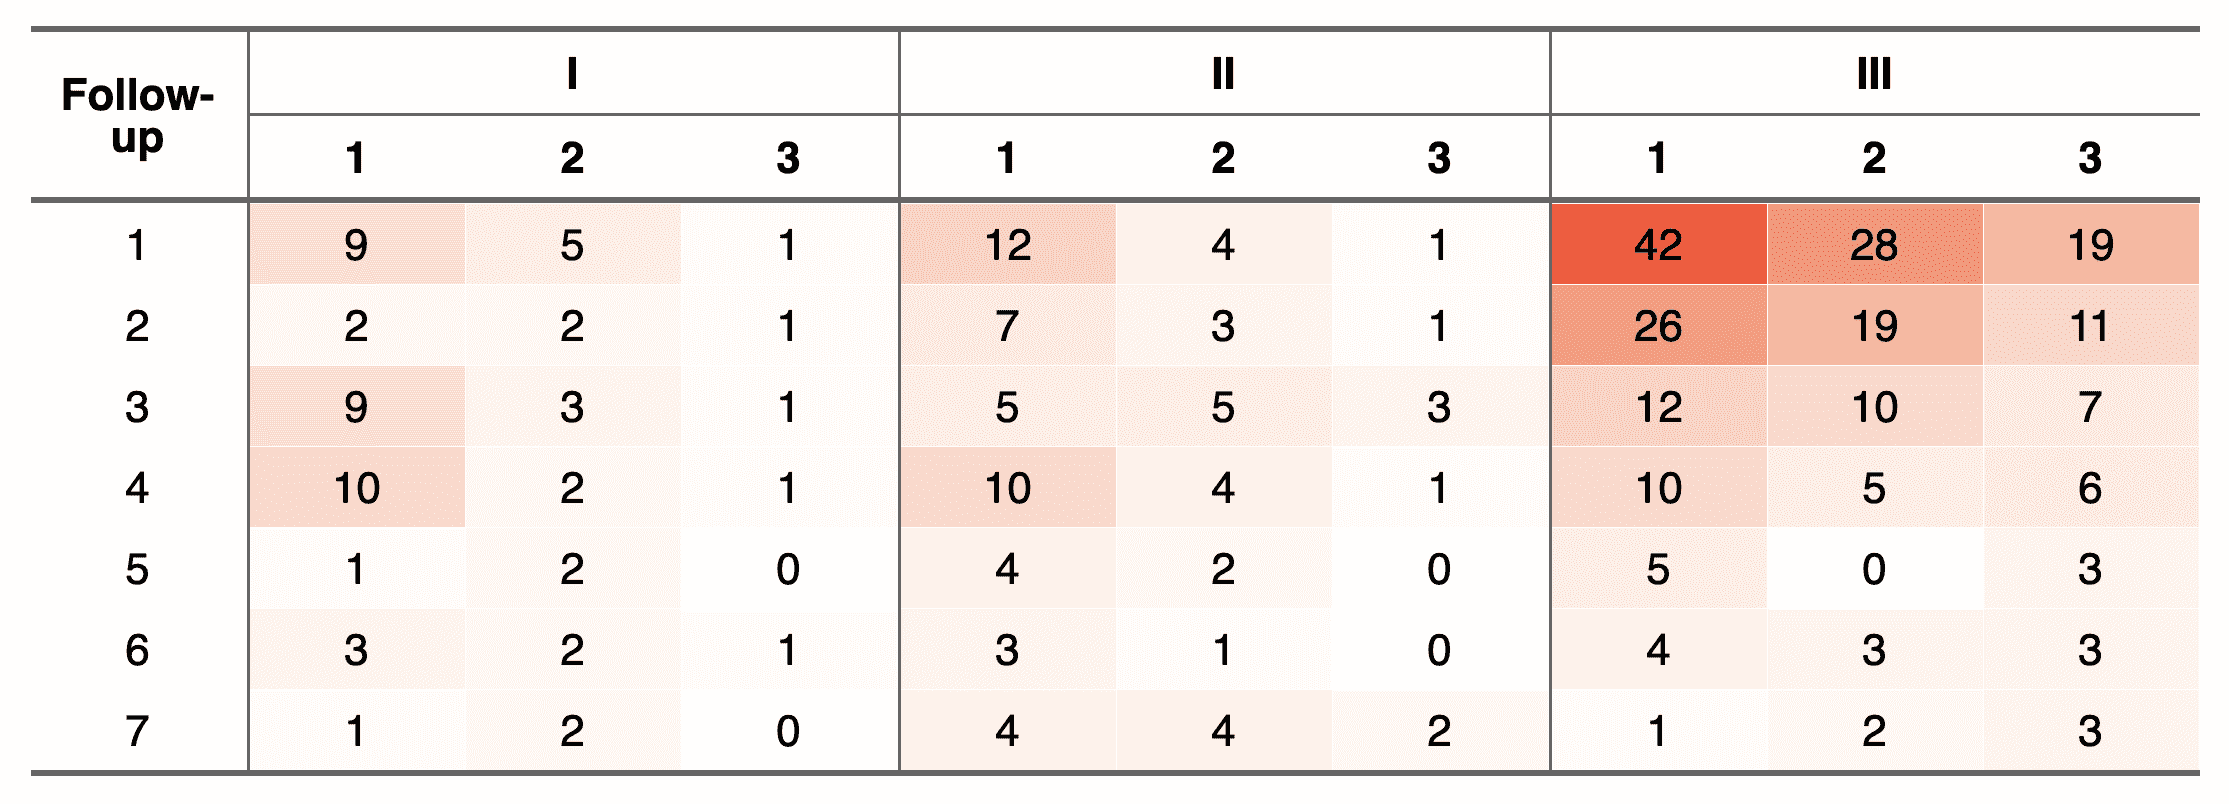
ftFollow-up | I | II | III | ||||||
1 | 2 | 3 | 1 | 2 | 3 | 1 | 2 | 3 | |
1 | 9 | 5 | 1 | 12 | 4 | 1 | 42 | 28 | 19 |
2 | 2 | 2 | 1 | 7 | 3 | 1 | 26 | 19 | 11 |
3 | 9 | 3 | 1 | 5 | 5 | 3 | 12 | 10 | 7 |
4 | 10 | 2 | 1 | 10 | 4 | 1 | 10 | 5 | 6 |
5 | 1 | 2 | 0 | 4 | 2 | 0 | 5 | 0 | 3 |
6 | 3 | 2 | 1 | 3 | 1 | 0 | 4 | 3 | 3 |
7 | 1 | 2 | 0 | 4 | 4 | 2 | 1 | 2 | 3 |