Demographic Tables with flextable
Introduction
Clinical studies often begin with a summary table of the demographic characteristics of the patients ncluded in the study to demonstrate a balance between treatments and other subgroups. This table is called “Demographic Tables”.
The format is standard and can be realized with flextable in 2 operations.
The two steps in creating these tables are:
- summarize the information with the
flextable::summarizor()function. It computes a set of statistics for each variable by groups. It returns a data.frame ready to be consumed byflextable::as_flextable(). - Create the flextable with the
as_flextable()function and customize it with the ‘flextable’ functions.
Example data
library(flextable)
library(officer)
library(tidyverse)
library(safetyData)

use_df_printer()

set_flextable_defaults(
  border.color = "#AAAAAA", font.family = "Arial",
  font.size = 10, padding = 2, line_spacing = 1.5
)
adsl <- select(adam_adsl, AGE, SEX, BMIBLGR1, DURDIS, ARM)
adslAGE | SEX | BMIBLGR1 | DURDIS | ARM |
|---|---|---|---|---|
numeric | character | character | numeric | character |
63 | F | 25-<30 | 43.9 | Placebo |
64 | M | >=30 | 76.4 | Placebo |
71 | M | >=30 | 42.8 | Xanomeline High Dose |
74 | M | 25-<30 | 55.3 | Xanomeline Low Dose |
77 | F | 25-<30 | 32.9 | Xanomeline High Dose |
85 | F | >=30 | 42.0 | Placebo |
68 | M | 25-<30 | 99.1 | Xanomeline Low Dose |
81 | F | <25 | 40.7 | Xanomeline Low Dose |
84 | M | <25 | 101.9 | Xanomeline Low Dose |
52 | M | <25 | 44.2 | Placebo |
n: 254 | ||||
Summaries
We will use the function flextable::summarizor(). It produces an aggregated data.frame
structured for flextable::as_flextable().
dat <- summarizor(adsl, by = "ARM")
datvariable | stat | value1 | value2 | cts | percent | data_type | ARM |
|---|---|---|---|---|---|---|---|
factor | factor | numeric | numeric | numeric | numeric | character | character |
AGE | mean_sd | 75.2 | 8.6 | continuous | Placebo | ||
AGE | median_iqr | 76.0 | 12.5 | continuous | Placebo | ||
AGE | range | 52.0 | 89.0 | continuous | Placebo | ||
AGE | missing | 0 | 0.0 | continuous | Placebo | ||
SEX | F | 53 | 0.6 | discrete | Placebo | ||
SEX | M | 33 | 0.4 | discrete | Placebo | ||
SEX | missing | 0 | 0.0 | discrete | Placebo | ||
BMIBLGR1 | <25 | 59 | 0.7 | discrete | Placebo | ||
BMIBLGR1 | >=30 | 6 | 0.1 | discrete | Placebo | ||
BMIBLGR1 | 25-<30 | 21 | 0.2 | discrete | Placebo | ||
n: 45 | |||||||
flextable creation
We want a visual where the treatments are distributed in columns and where the content of the paragraphs is flexible enough to allow the creation of the table.
ft <- as_flextable(dat)
ftPlacebo | Xanomeline High Dose | Xanomeline Low Dose | |||||
|---|---|---|---|---|---|---|---|
AGE | Mean (SD) | 75.2 (8.6) | 74.4 (7.9) | 75.7 (8.3) | |||
Median (IQR) | 76.0 (12.5) | 76.0 (9.2) | 77.5 (11.0) | ||||
Range | 52.0 - 89.0 | 56.0 - 88.0 | 51.0 - 88.0 | ||||
Missing | 0 (0.00%) | 0 (0.00%) | 0 (0.00%) | ||||
SEX | F | 53 (61.63%) | 40 (47.62%) | 50 (59.52%) | |||
M | 33 (38.37%) | 44 (52.38%) | 34 (40.48%) | ||||
Missing | 0 (0.00%) | 0 (0.00%) | 0 (0.00%) | ||||
BMIBLGR1 | <25 | 59 (68.60%) | 44 (52.38%) | 47 (55.95%) | |||
>=30 | 6 (6.98%) | 12 (14.29%) | 10 (11.90%) | ||||
25-<30 | 21 (24.42%) | 28 (33.33%) | 27 (32.14%) | ||||
Missing | 0 (0.00%) | 0 (0.00%) | 0 (0.00%) | ||||
DURDIS | Mean (SD) | 42.6 (30.2) | 40.5 (24.7) | 48.7 (29.6) | |||
Median (IQR) | 35.3 (25.8) | 36.0 (28.6) | 40.2 (39.9) | ||||
Range | 7.2 - 183.1 | 2.2 - 135.0 | 7.8 - 130.8 | ||||
Missing | 0 (0.00%) | 0 (0.00%) | 0 (0.00%) |
The flextable::as_flextable() method supports the arguments of the flextable::tabulator() method,
we’ll use the spread_first_col = TRUE argument to split the variable names as separator lines
and not display the column anymore. We will also add a caption and a note at the bottom of
the table and some additional parameters.
ft <- as_flextable(dat, spread_first_col = TRUE, separate_with = "variable") %>%
  bold(i = ~ !is.na(variable), j = 1, bold = TRUE) %>%
  set_caption(
    autonum = officer::run_autonum(seq_id = "tab", bkm = "demo_tab", bkm_all = FALSE),
    fp_p = officer::fp_par(text.align = "left", padding = 5),
    align_with_table = FALSE,
    caption = as_paragraph(
          "Demographic Characteristics",
          "\nx.x: Study Subject Data"
        )
  ) %>%
  add_footer_lines("Source: ADaM adsl data frame from r package 'safetyData'") %>%
  fix_border_issues() %>%
  autofit()
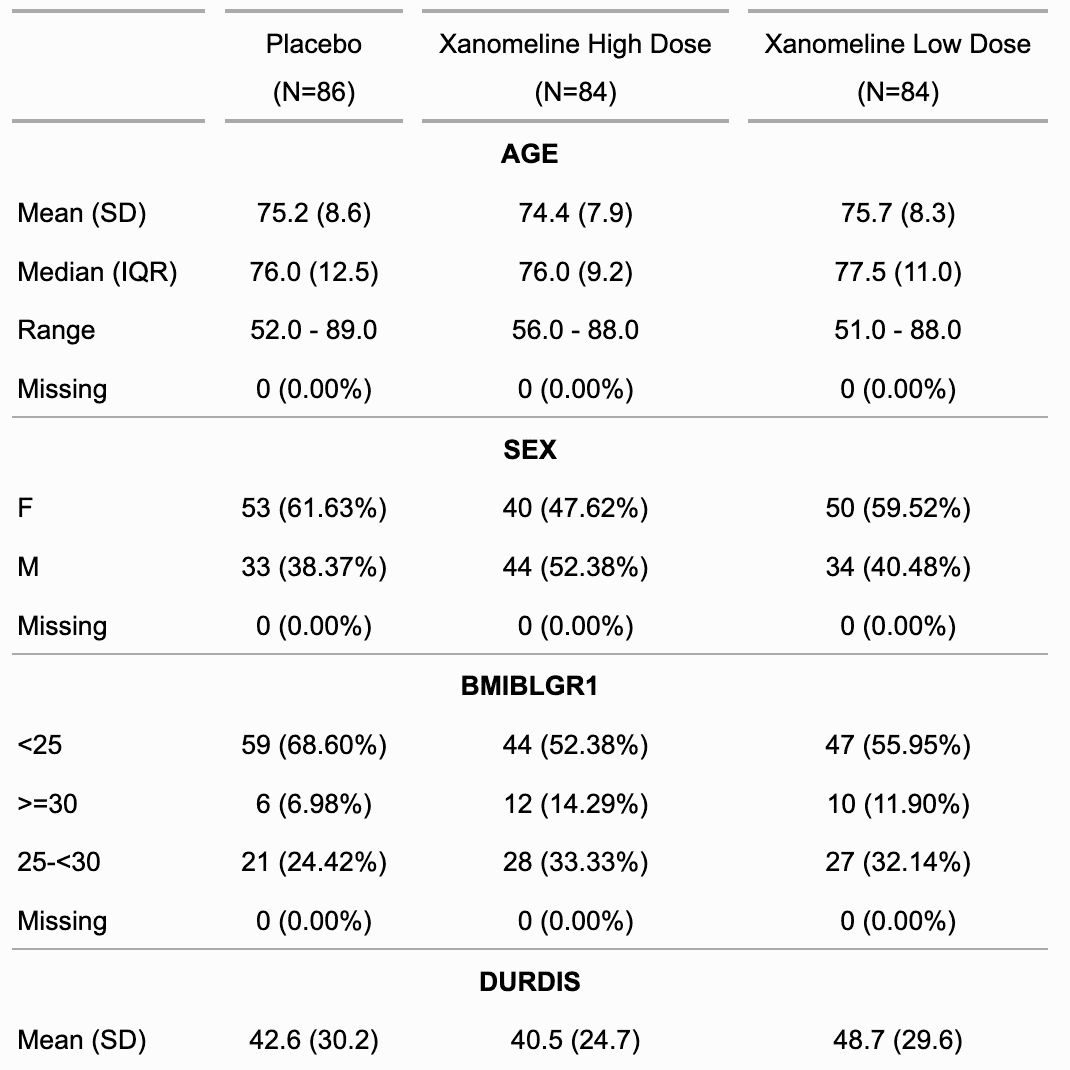
ftPlacebo | Xanomeline High Dose | Xanomeline Low Dose | ||||
|---|---|---|---|---|---|---|
AGE | ||||||
Mean (SD) | 75.2 (8.6) | 74.4 (7.9) | 75.7 (8.3) | |||
Median (IQR) | 76.0 (12.5) | 76.0 (9.2) | 77.5 (11.0) | |||
Range | 52.0 - 89.0 | 56.0 - 88.0 | 51.0 - 88.0 | |||
Missing | 0 (0.00%) | 0 (0.00%) | 0 (0.00%) | |||
SEX | ||||||
F | 53 (61.63%) | 40 (47.62%) | 50 (59.52%) | |||
M | 33 (38.37%) | 44 (52.38%) | 34 (40.48%) | |||
Missing | 0 (0.00%) | 0 (0.00%) | 0 (0.00%) | |||
BMIBLGR1 | ||||||
<25 | 59 (68.60%) | 44 (52.38%) | 47 (55.95%) | |||
>=30 | 6 (6.98%) | 12 (14.29%) | 10 (11.90%) | |||
25-<30 | 21 (24.42%) | 28 (33.33%) | 27 (32.14%) | |||
Missing | 0 (0.00%) | 0 (0.00%) | 0 (0.00%) | |||
DURDIS | ||||||
Mean (SD) | 42.6 (30.2) | 40.5 (24.7) | 48.7 (29.6) | |||
Median (IQR) | 35.3 (25.8) | 36.0 (28.6) | 40.2 (39.9) | |||
Range | 7.2 - 183.1 | 2.2 - 135.0 | 7.8 - 130.8 | |||
Missing | 0 (0.00%) | 0 (0.00%) | 0 (0.00%) | |||
Source: ADaM adsl data frame from r package 'safetyData' | ||||||
Labels
This part will allow us to retrieve a set of labels that we will use to replace some texts displayed in the flextable.
The function to use is labelizor(), it takes a simple argument as a named vector,
the names are the values to replace, the values are the replacement values.
We will retrieve the labels of the columns stored in the original table.
col_labels <- map_chr(adsl, function(x) attr(x, "label"))
col_labels
##                            AGE                            SEX
##                          "Age"                          "Sex"
##                       BMIBLGR1                         DURDIS
##  "Pooled Baseline BMI Group 1" "Duration of Disease (Months)"
##                            ARM
##   "Description of Planned Arm"

ft <- labelizor(ft, j = "stat", labels = col_labels, part = "all")
ftPlacebo | Xanomeline High Dose | Xanomeline Low Dose | ||||
|---|---|---|---|---|---|---|
Age | ||||||
Mean (SD) | 75.2 (8.6) | 74.4 (7.9) | 75.7 (8.3) | |||
Median (IQR) | 76.0 (12.5) | 76.0 (9.2) | 77.5 (11.0) | |||
Range | 52.0 - 89.0 | 56.0 - 88.0 | 51.0 - 88.0 | |||
Missing | 0 (0.00%) | 0 (0.00%) | 0 (0.00%) | |||
Sex | ||||||
F | 53 (61.63%) | 40 (47.62%) | 50 (59.52%) | |||
M | 33 (38.37%) | 44 (52.38%) | 34 (40.48%) | |||
Missing | 0 (0.00%) | 0 (0.00%) | 0 (0.00%) | |||
Pooled Baseline BMI Group 1 | ||||||
<25 | 59 (68.60%) | 44 (52.38%) | 47 (55.95%) | |||
>=30 | 6 (6.98%) | 12 (14.29%) | 10 (11.90%) | |||
25-<30 | 21 (24.42%) | 28 (33.33%) | 27 (32.14%) | |||
Missing | 0 (0.00%) | 0 (0.00%) | 0 (0.00%) | |||
Duration of Disease (Months) | ||||||
Mean (SD) | 42.6 (30.2) | 40.5 (24.7) | 48.7 (29.6) | |||
Median (IQR) | 35.3 (25.8) | 36.0 (28.6) | 40.2 (39.9) | |||
Range | 7.2 - 183.1 | 2.2 - 135.0 | 7.8 - 130.8 | |||
Missing | 0 (0.00%) | 0 (0.00%) | 0 (0.00%) | |||
Source: ADaM adsl data frame from r package 'safetyData' | ||||||
In a Word document
We will prepare the table for exportation in a Word document by adding a header line with the page number. The caption will be auto-numbered and left aligned in the document.
ft %>%
  add_header_lines("Page ") %>%
  append_chunks(i = 1, part = "header", j = 1, as_word_field(x = "Page")) %>%
  save_as_docx(path = "adsl.docx")
The resulting Word document can be downloaded here: adsl.docx. A miniature below show the expected document.
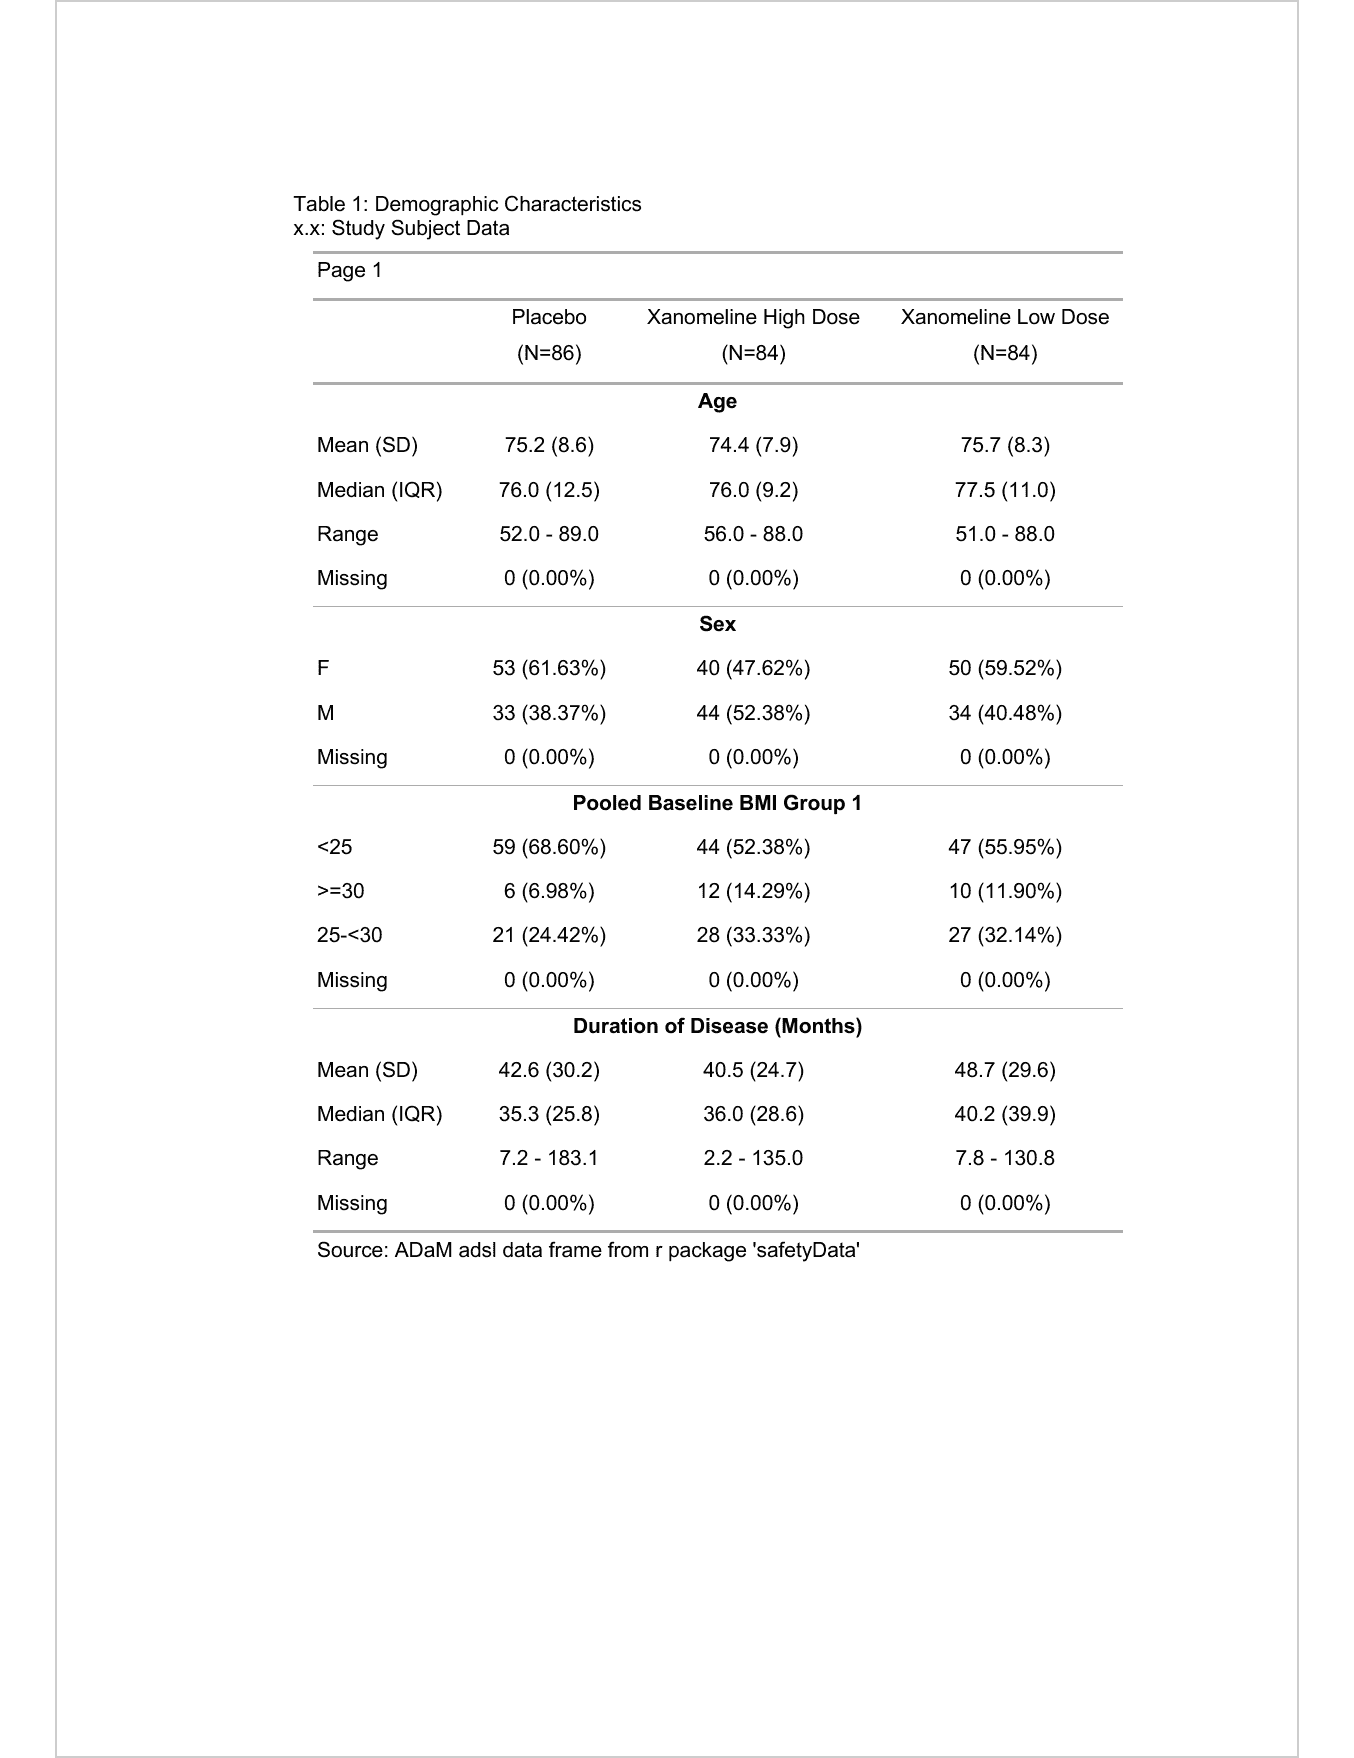
Word miniatures