Ranking of tennis players
Packages
library(flextable)
library(dplyr)
Data
This dataset was created by hand. It represents a ranking of tennis players. It includes in addition to some statistics the names of the images representing the flag of the player’s country of origin as well as a picture of the player.
tennis_players <-
  data.frame(
    Rank = 1:10,
    Player = c(
      "Roger Federer", "Lleyton Hewitt", "Feliciano Lopez", "Ivo Karlovic", "Andy Murray",
      "Pete Sampras", "Greg Rusedski", "Tim Henman", "Novak Djokovic", "Andy Roddick"
    ),
    Percentage = c(92.63, 85.29, 89.86, 94.87, 88.89, 92.66, 90.33, 83.77, 89.12, 92.76),
    `Games Won` = c(2739L, 1740L, 1684L, 1645L, 1528L, 1478L, 1476L, 1461L, 1442L, 1410L),
    `Total Games` = c(2957L, 2040L, 1874L, 1734L, 1719L, 1595L, 1634L, 1744L, 1618L, 1520L),
    Matches = c(205L, 149L, 122L, 113L, 121L, 105L, 116L, 110L, 106L, 103L),
    head = c(
      "federer_head.png", "hewitt_head.png", "lopez_head.png", "karlovic_head.png",
      "murray_head.png", "sampras_head.png", "rusedski_head.png", "henman_head.png",
      "djokovic_head.png", "roddick_head.png"
    ),
    flag = c(
      "sui.png", "aus.png", "esp.png", "cro.png", "gbr.png", "usa.png",
      "gbr.png", "gbr.png", "srb.png", "usa.png"
    ),
    stringsAsFactors = FALSE
  ) %>%
  mutate(
    head = file.path("players", head),
    flag = file.path("flags", flag)
  )
tennis_players
##    Rank          Player Percentage Games.Won Total.Games Matches
## 1     1   Roger Federer      92.63      2739        2957     205
## 2     2  Lleyton Hewitt      85.29      1740        2040     149
## 3     3 Feliciano Lopez      89.86      1684        1874     122
## 4     4    Ivo Karlovic      94.87      1645        1734     113
## 5     5     Andy Murray      88.89      1528        1719     121
## 6     6    Pete Sampras      92.66      1478        1595     105
## 7     7   Greg Rusedski      90.33      1476        1634     116
## 8     8      Tim Henman      83.77      1461        1744     110
## 9     9  Novak Djokovic      89.12      1442        1618     106
## 10   10    Andy Roddick      92.76      1410        1520     103
##                         head          flag
## 1   players/federer_head.png flags/sui.png
## 2    players/hewitt_head.png flags/aus.png
## 3     players/lopez_head.png flags/esp.png
## 4  players/karlovic_head.png flags/cro.png
## 5    players/murray_head.png flags/gbr.png
## 6   players/sampras_head.png flags/usa.png
## 7  players/rusedski_head.png flags/gbr.png
## 8    players/henman_head.png flags/gbr.png
## 9  players/djokovic_head.png flags/srb.png
## 10  players/roddick_head.png flags/usa.png
Images
The images listed in the data.frame above are available in two directories of the current project.
The players’ images are in the “players” directory.
list.files("players")
##  [1] "djokovic_head.png" "federer_head.png"  "henman_head.png"
##  [4] "hewitt_head.png"   "karlovic_head.png" "lopez_head.png"
##  [7] "murray_head.png"   "roddick_head.png"  "rusedski_head.png"
## [10] "sampras_head.png"
The flags are in the “flags” directory.
list.files("flags")
## [1] "aus.png" "cro.png" "esp.png" "gbr.png" "srb.png" "sui.png" "usa.png"
Flextable code
First, we will create a table with the tennis_players dataset. We won’t display all the columns.
ft <- flextable(tennis_players,
  col_keys = c(
    "Rank", "Player", "Percentage",
    "Games.Won", "Total.Games", "Matches"
  )
)
ft <- flextable(tennis_players,
col_keys = c("flag",
"Rank", "Player", "Percentage",
"Games.Won", "Total.Games", "Matches"
)
)
ftflag | Rank | Player | Percentage | Games.Won | Total.Games | Matches |
flags/sui.png | 1 | Roger Federer | 92.63 | 2,739 | 2,957 | 205 |
flags/aus.png | 2 | Lleyton Hewitt | 85.29 | 1,740 | 2,040 | 149 |
flags/esp.png | 3 | Feliciano Lopez | 89.86 | 1,684 | 1,874 | 122 |
flags/cro.png | 4 | Ivo Karlovic | 94.87 | 1,645 | 1,734 | 113 |
flags/gbr.png | 5 | Andy Murray | 88.89 | 1,528 | 1,719 | 121 |
flags/usa.png | 6 | Pete Sampras | 92.66 | 1,478 | 1,595 | 105 |
flags/gbr.png | 7 | Greg Rusedski | 90.33 | 1,476 | 1,634 | 116 |
flags/gbr.png | 8 | Tim Henman | 83.77 | 1,461 | 1,744 | 110 |
flags/srb.png | 9 | Novak Djokovic | 89.12 | 1,442 | 1,618 | 106 |
flags/usa.png | 10 | Andy Roddick | 92.76 | 1,410 | 1,520 | 103 |
The flag of the player’s country is printed in the “Country” column.
ft <- compose(ft,
    j = "flag",
    value = as_paragraph(
      as_image(src = flag, width = .5, height = 0.33)
    )
  ) |>
  set_header_labels(flag = "Country")

ftCountry | Rank | Player | Percentage | Games.Won | Total.Games | Matches |
| 1 | Roger Federer | 92.63 | 2,739 | 2,957 | 205 |
| 2 | Lleyton Hewitt | 85.29 | 1,740 | 2,040 | 149 |
| 3 | Feliciano Lopez | 89.86 | 1,684 | 1,874 | 122 |
| 4 | Ivo Karlovic | 94.87 | 1,645 | 1,734 | 113 |
| 5 | Andy Murray | 88.89 | 1,528 | 1,719 | 121 |
| 6 | Pete Sampras | 92.66 | 1,478 | 1,595 | 105 |
| 7 | Greg Rusedski | 90.33 | 1,476 | 1,634 | 116 |
| 8 | Tim Henman | 83.77 | 1,461 | 1,744 | 110 |
| 9 | Novak Djokovic | 89.12 | 1,442 | 1,618 | 106 |
| 10 | Andy Roddick | 92.76 | 1,410 | 1,520 | 103 |


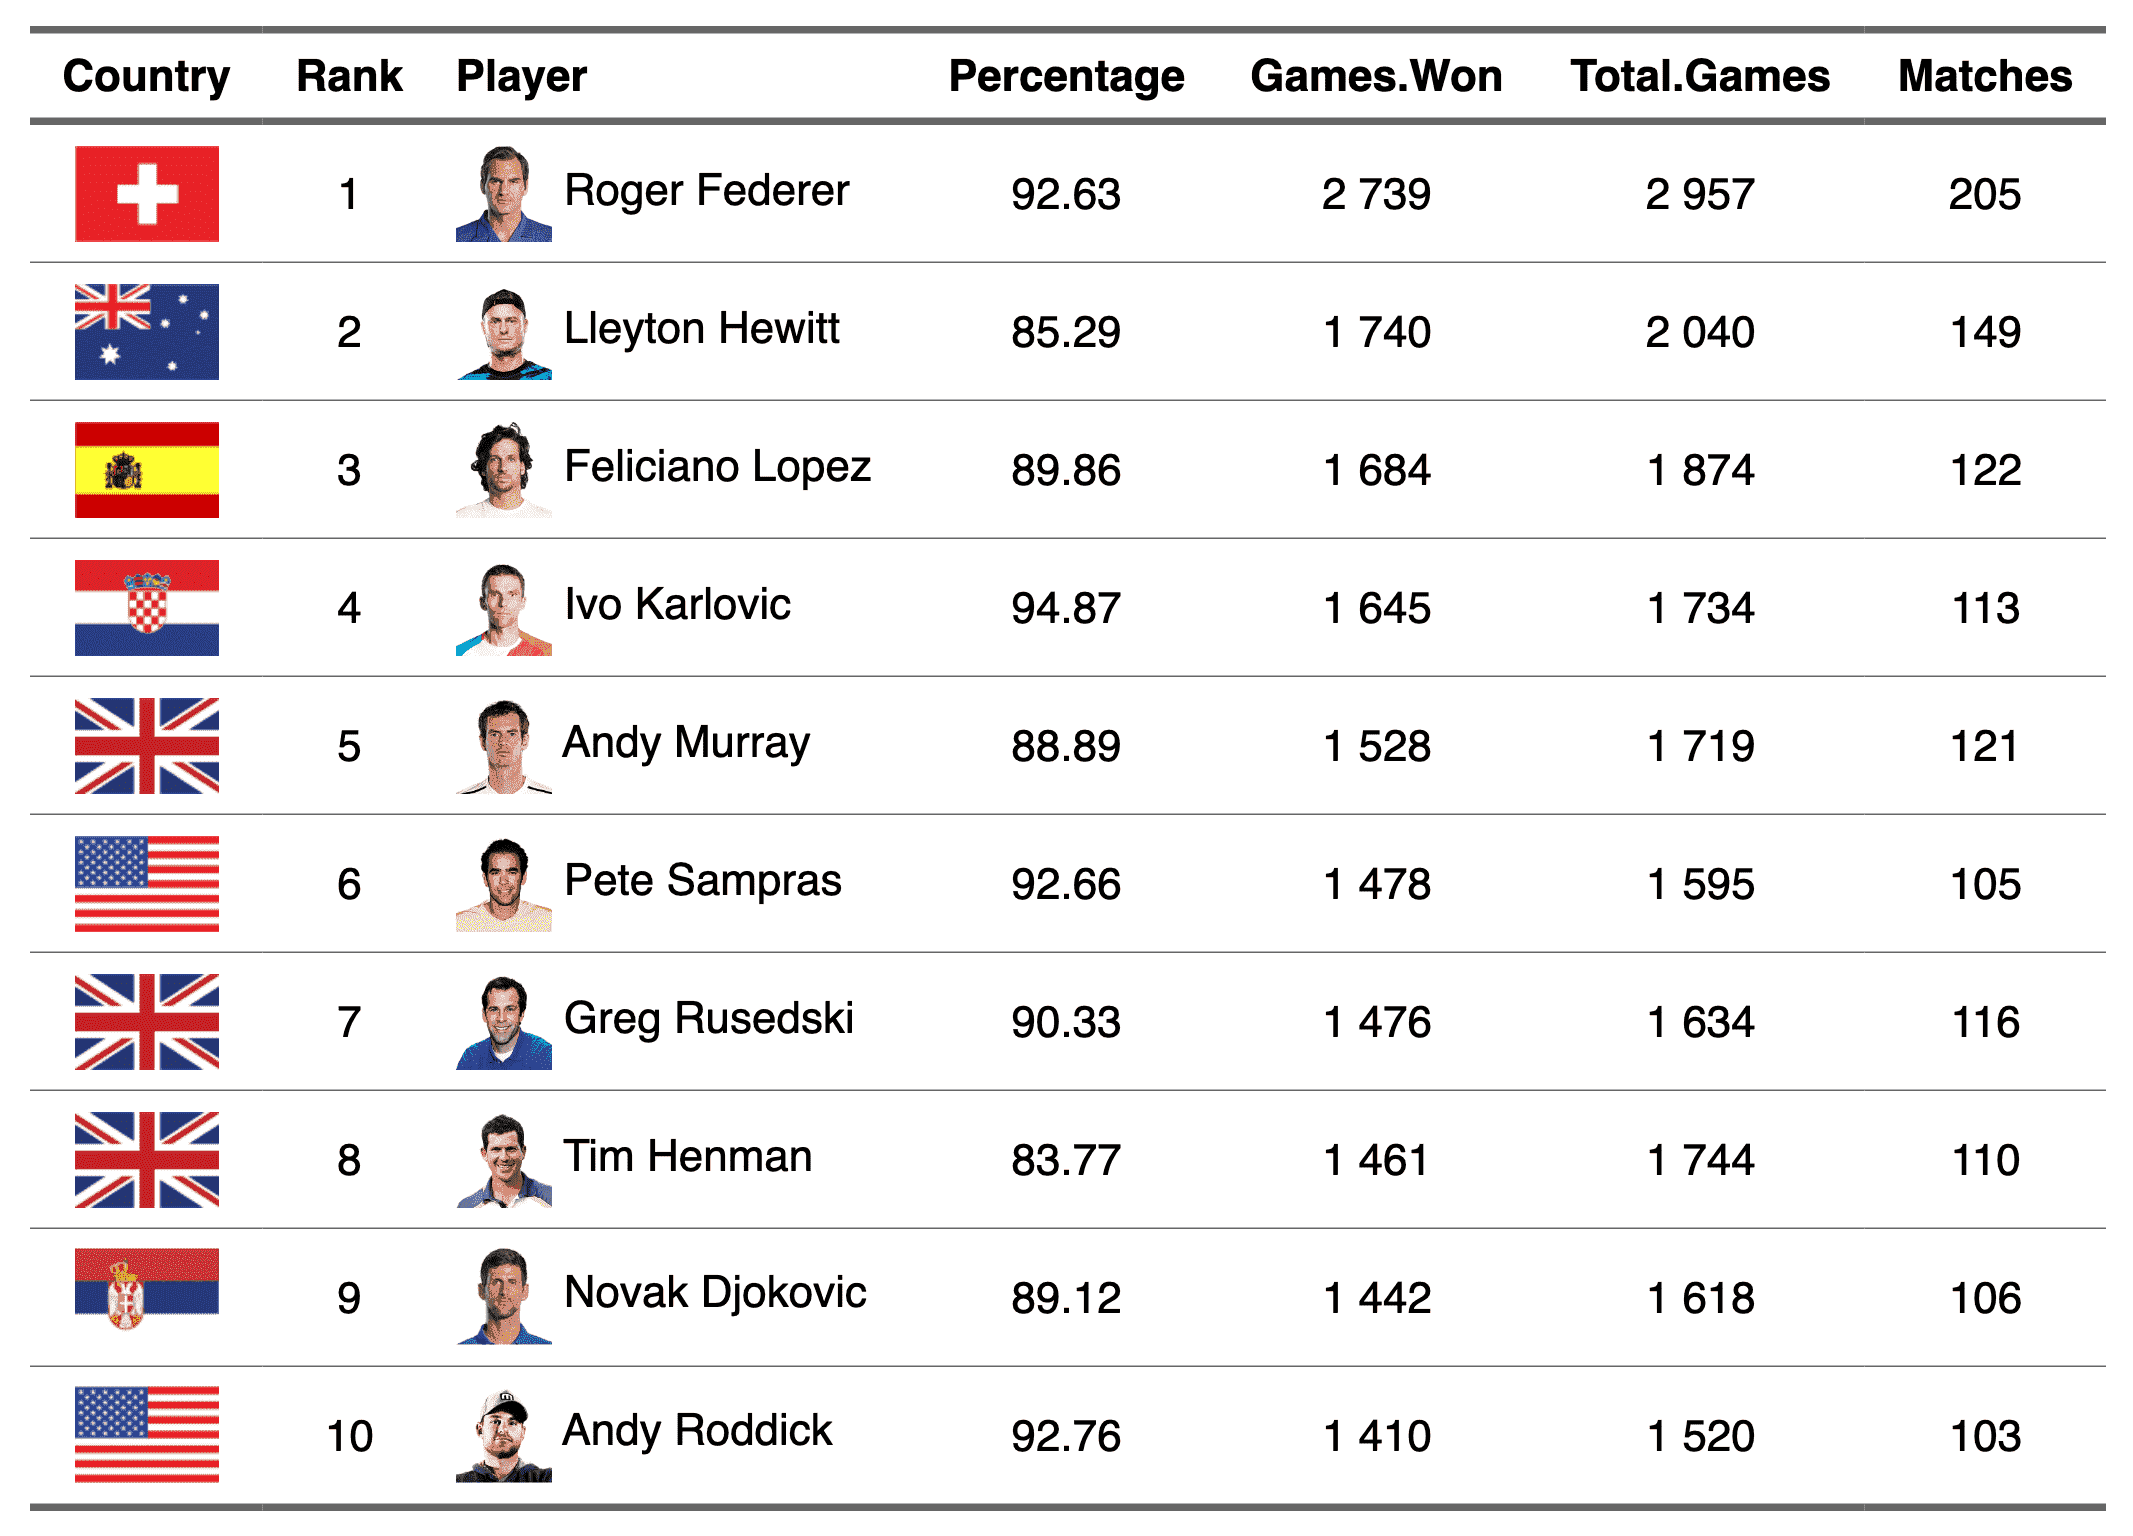
Now we will rewrite the content of the “Player” column by concatenating the player’s portrait and his name.
ft <- compose(ft,
    j = "Player",
    value = as_paragraph(
      as_image(src = head, width = .33, height = 0.33),
      " ",
      as_chunk(x = Player)
    )
  )
ftCountry | Rank | Player | Percentage | Games.Won | Total.Games | Matches |
| 1 |
| 92.63 | 2,739 | 2,957 | 205 |
| 2 |
| 85.29 | 1,740 | 2,040 | 149 |
| 3 |
| 89.86 | 1,684 | 1,874 | 122 |
| 4 |
| 94.87 | 1,645 | 1,734 | 113 |
| 5 |
| 88.89 | 1,528 | 1,719 | 121 |
| 6 |
| 92.66 | 1,478 | 1,595 | 105 |
| 7 |
| 90.33 | 1,476 | 1,634 | 116 |
| 8 |
| 83.77 | 1,461 | 1,744 | 110 |
| 9 |
| 89.12 | 1,442 | 1,618 | 106 |
| 10 |
| 92.76 | 1,410 | 1,520 | 103 |


It only remains to apply a theme function.
ft <- theme_vanilla(ft) |>
  align(align = "center", part = "all") |>
  align(align = "left", j = "Player", part = "all") |>
  autofit(add_w = .1, unit = "cm")
ftCountry | Rank | Player | Percentage | Games.Won | Total.Games | Matches |
| 1 |
| 92.63 | 2,739 | 2,957 | 205 |
| 2 |
| 85.29 | 1,740 | 2,040 | 149 |
| 3 |
| 89.86 | 1,684 | 1,874 | 122 |
| 4 |
| 94.87 | 1,645 | 1,734 | 113 |
| 5 |
| 88.89 | 1,528 | 1,719 | 121 |
| 6 |
| 92.66 | 1,478 | 1,595 | 105 |
| 7 |
| 90.33 | 1,476 | 1,634 | 116 |
| 8 |
| 83.77 | 1,461 | 1,744 | 110 |
| 9 |
| 89.12 | 1,442 | 1,618 | 106 |
| 10 |
| 92.76 | 1,410 | 1,520 | 103 |