Separate column names in header
library(flextable)
use_df_printer()
set_flextable_defaults(
  theme_fun = theme_booktabs,
  big.mark = " ",
  font.color = "#666666",
  border.color = "#666666",
  padding = 3,
)
In the following example we aggregate the famous ‘penguins’ table.
First, let’s create a summary of the original dataset.
library(tidyverse)
library(palmerpenguins)

dat <- penguins |>
  select(species, island, ends_with("mm")) |>
  group_by(species, island) |>
  summarise(
    across(
      where(is.numeric),
      .fns = list(
        avg = ~ mean(.x, na.rm = TRUE),
        sd = ~ sd(.x, na.rm = TRUE)
      )
    ),
    .groups = "drop") |>
  rename_with(~ tolower(gsub("_mm_", "_", .x, fixed = TRUE)))

print(dat)
## # A tibble: 5 × 8
##   species   island   bill_length_avg bill_length_sd bill_depth_avg bill_depth_sd
##   <fct>     <fct>              <dbl>          <dbl>          <dbl>         <dbl>
## 1 Adelie    Biscoe              39.0           2.48           18.4         1.19
## 2 Adelie    Dream               38.5           2.47           18.3         1.13
## 3 Adelie    Torgers…            39.0           3.03           18.4         1.34
## 4 Chinstrap Dream               48.8           3.34           18.4         1.14
## 5 Gentoo    Biscoe              47.5           3.08           15.0         0.981
## # … with 2 more variables: flipper_length_avg <dbl>, flipper_length_sd <dbl>
From this dataset, we create the ‘flextable’ and restructure header labels by using separate_header().
ft <- dat |>
  flextable() |>
  separate_header() |>
  autofit()
ftspecies | island | bill | flipper | ||||
length | depth | length | |||||
avg | sd | avg | sd | avg | sd | ||
Adelie | Biscoe | 38.97500 | 2.480916 | 18.37045 | 1.1888199 | 188.7955 | 6.729247 |
Adelie | Dream | 38.50179 | 2.465359 | 18.25179 | 1.1336171 | 189.7321 | 6.585083 |
Adelie | Torgersen | 38.95098 | 3.025318 | 18.42941 | 1.3394468 | 191.1961 | 6.232238 |
Chinstrap | Dream | 48.83382 | 3.339256 | 18.42059 | 1.1353951 | 195.8235 | 7.131894 |
Gentoo | Biscoe | 47.50488 | 3.081857 | 14.98211 | 0.9812198 | 217.1870 | 6.484976 |
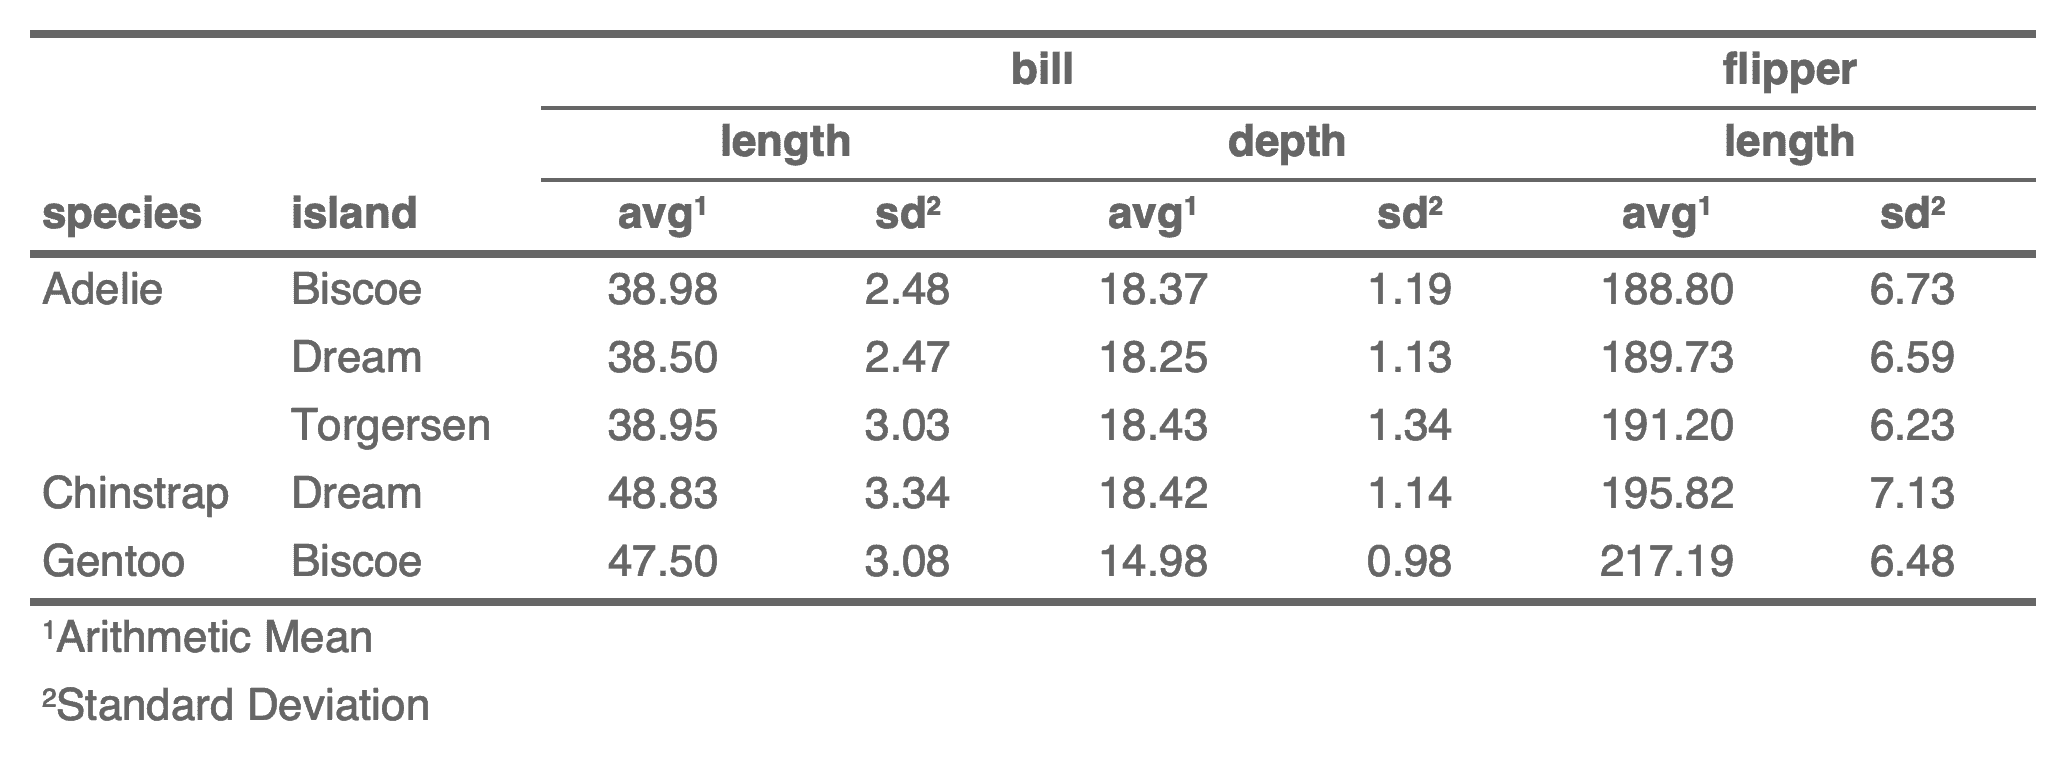
This flextable can be customized now so that we produce a prettier reporting table.
ft <- ft |>
  theme_booktabs(bold_header = TRUE) |>
  footnote(i = 3, j = grep("_avg$", colnames(dat), value = TRUE),
           part = "header",
           ref_symbols = "1", value = as_paragraph("Arithmetic Mean")) |>
  footnote(i = 3, j = grep("_sd$", colnames(dat), value = TRUE),
           part = "header",
           ref_symbols = "2", value = as_paragraph("Standard Deviation")) |>
  align(align = "center", part = "all", j = 3:8) |>
  merge_v(j = 1) |>
  valign(j = 1, valign = "top") |>
  colformat_double(digits = 2)
ftspecies | island | bill | flipper | ||||
length | depth | length | |||||
avg1 | sd2 | avg1 | sd2 | avg1 | sd2 | ||
Adelie | Biscoe | 38.98 | 2.48 | 18.37 | 1.19 | 188.80 | 6.73 |
Dream | 38.50 | 2.47 | 18.25 | 1.13 | 189.73 | 6.59 | |
Torgersen | 38.95 | 3.03 | 18.43 | 1.34 | 191.20 | 6.23 | |
Chinstrap | Dream | 48.83 | 3.34 | 18.42 | 1.14 | 195.82 | 7.13 |
Gentoo | Biscoe | 47.50 | 3.08 | 14.98 | 0.98 | 217.19 | 6.48 |
1Arithmetic Mean | |||||||
2Standard Deviation | |||||||