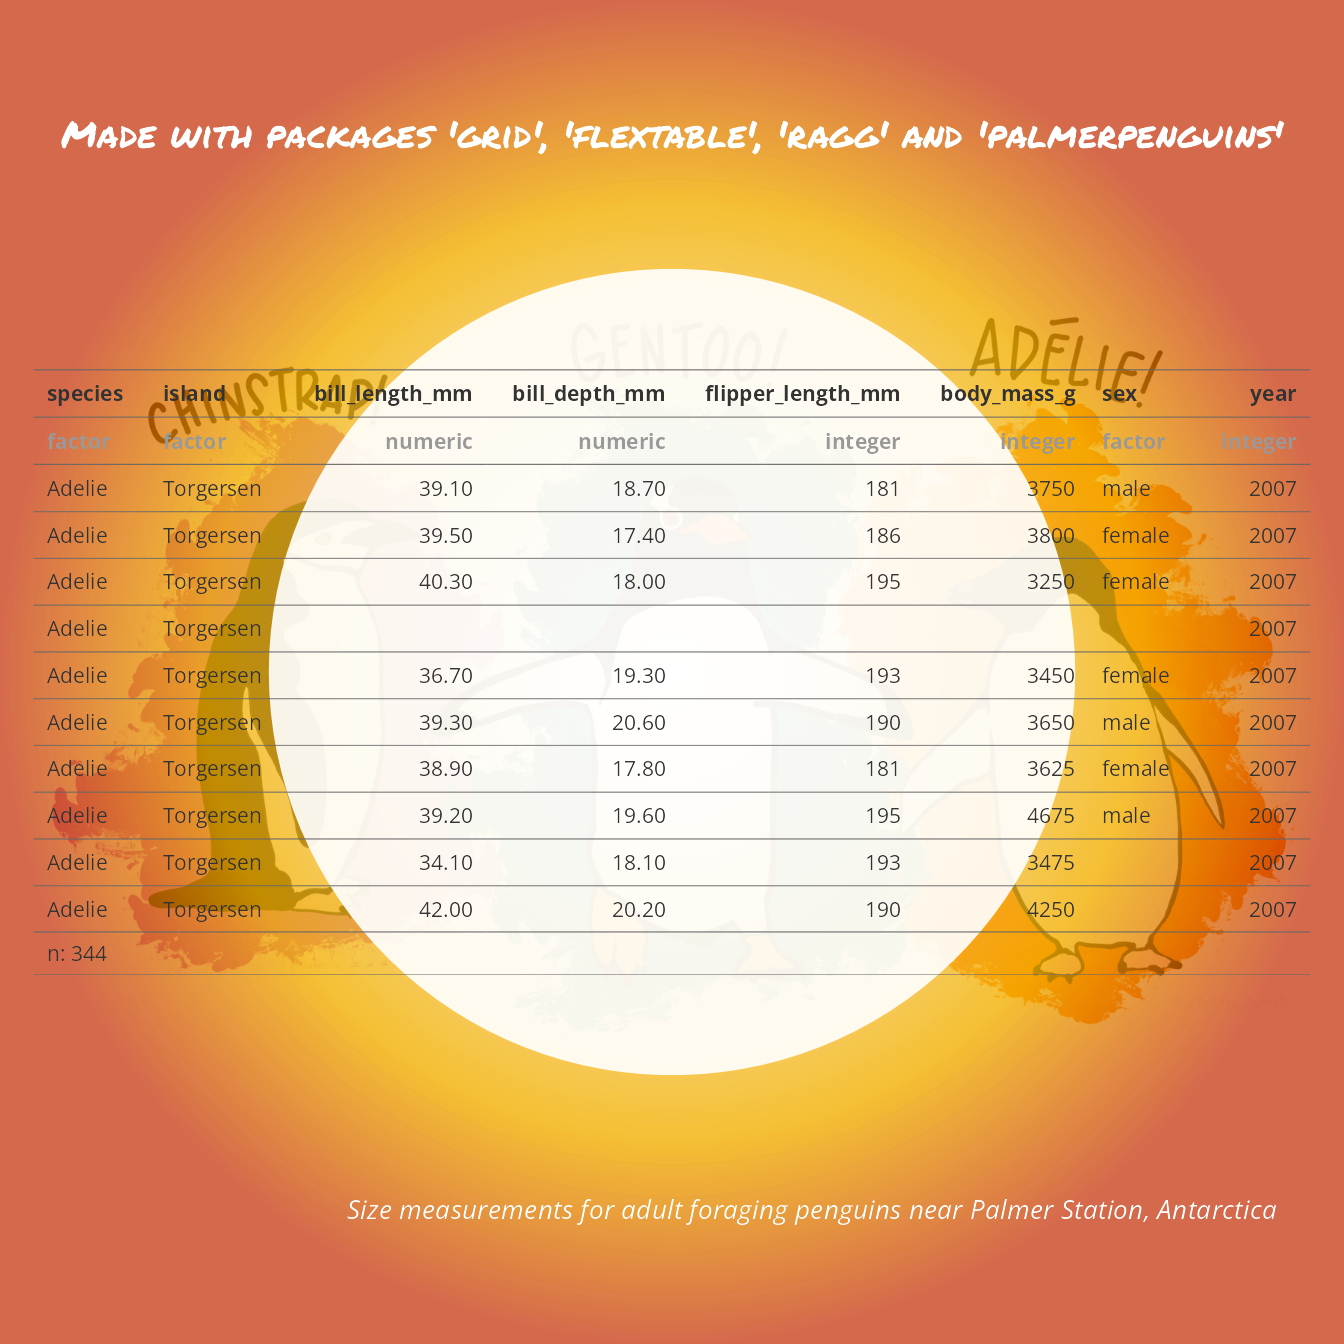
grid clipping and flextable
An exemple that shows how to transform a flextable into a nice data-visualisation.
Our posts tagged
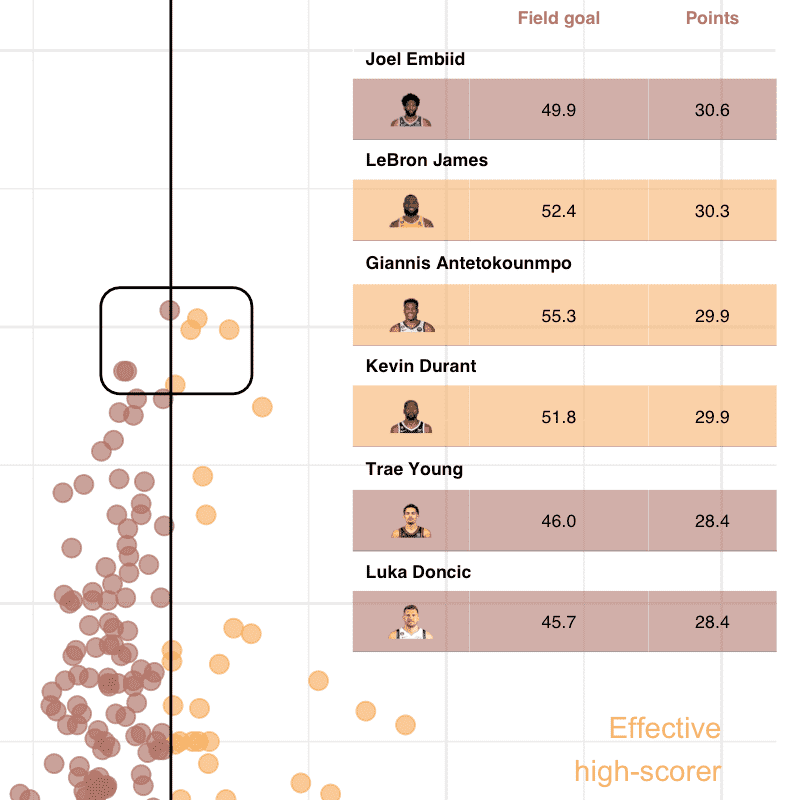
flextable::gen_grob() and package ‘patchwork’ to mix graphics and tables.
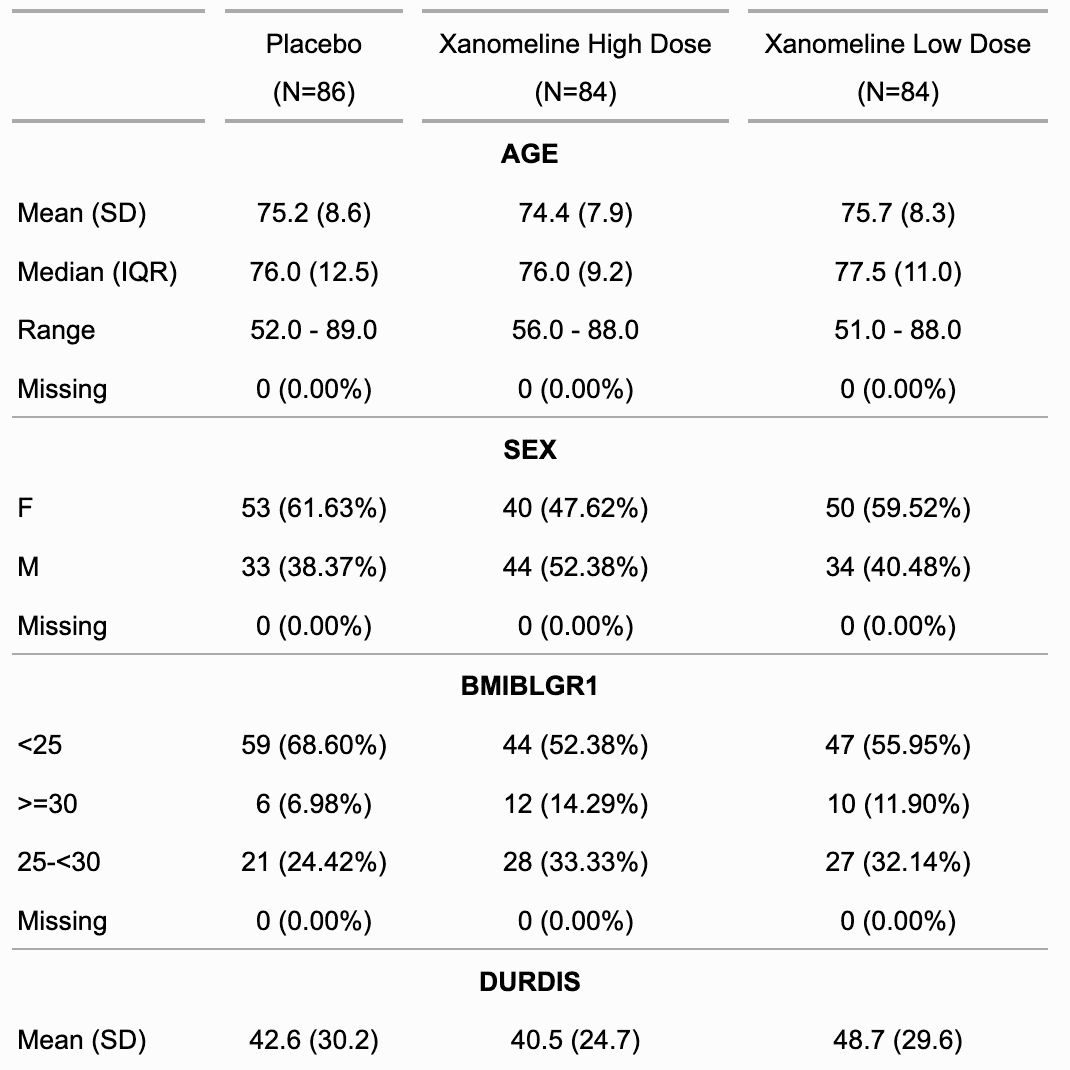
summarizor().
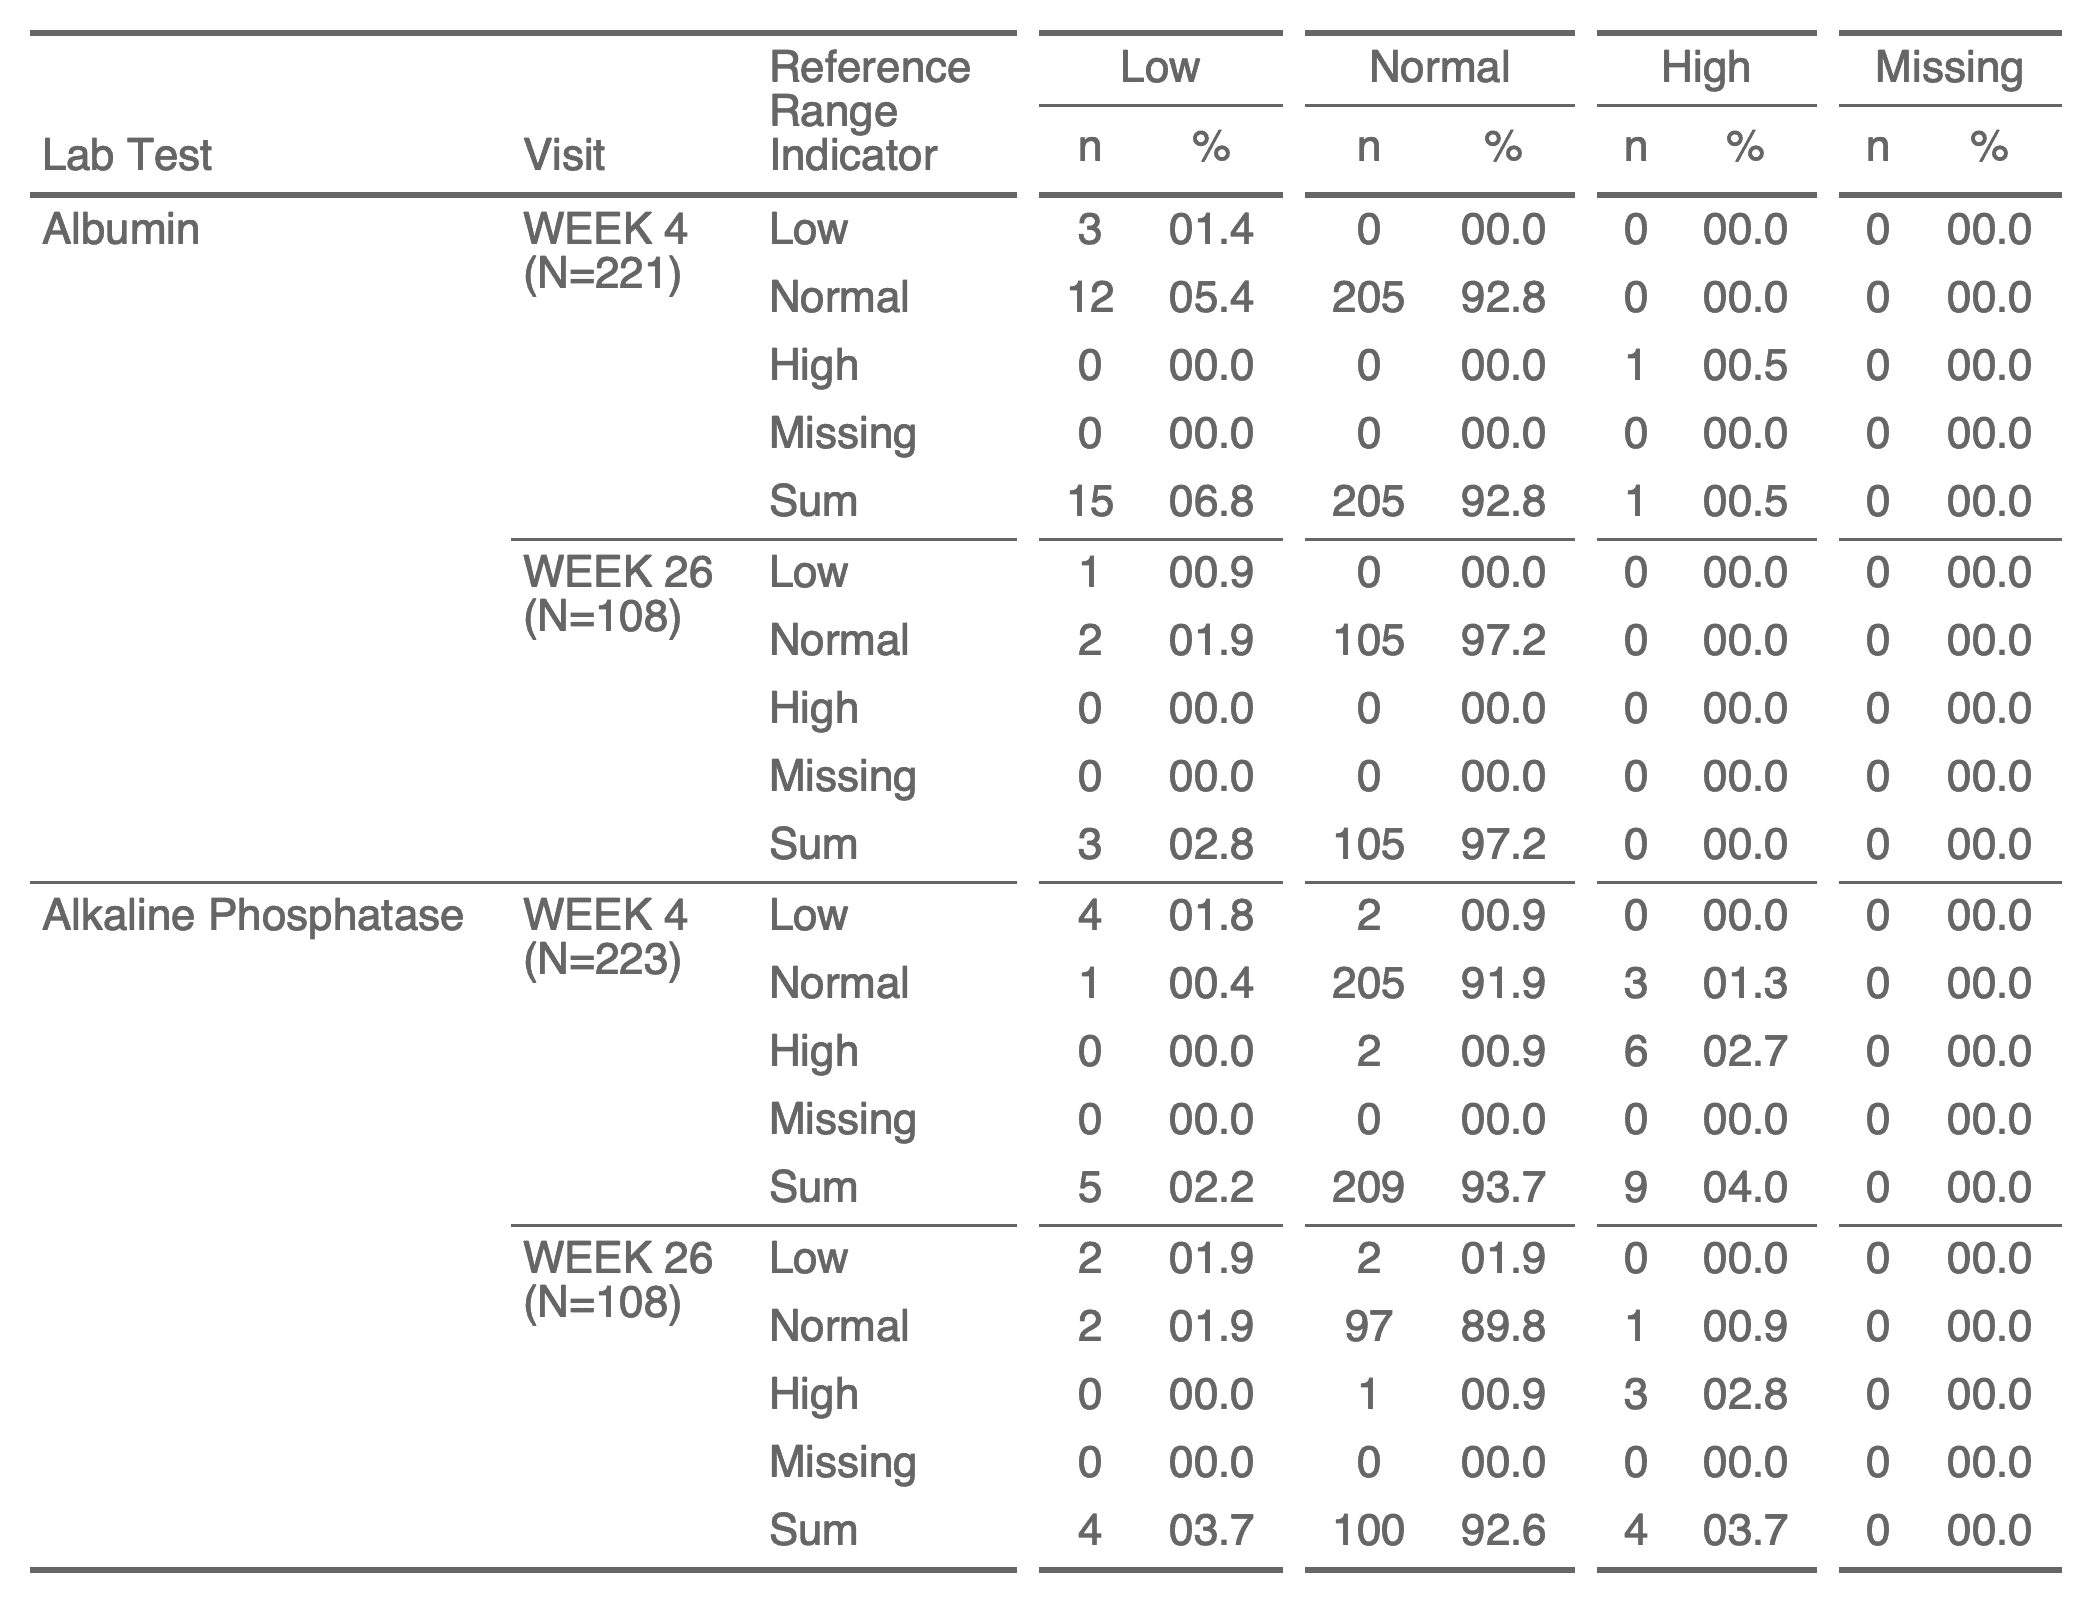
shift_table() and flextable::tabulator().
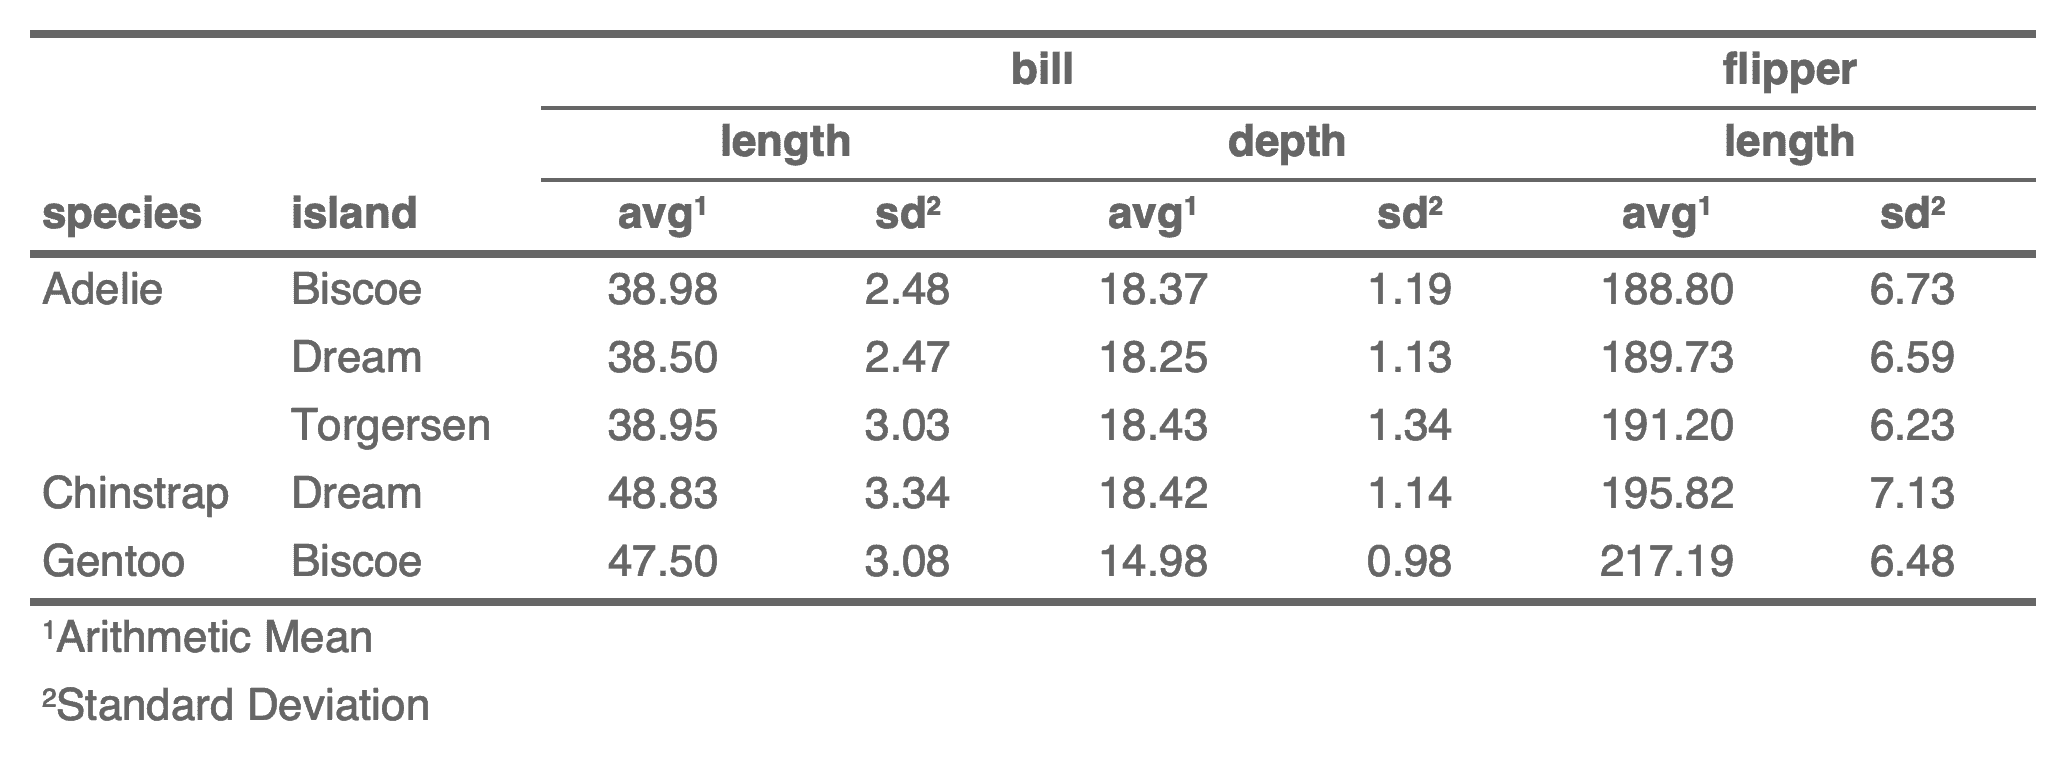
dplyr::summarise().
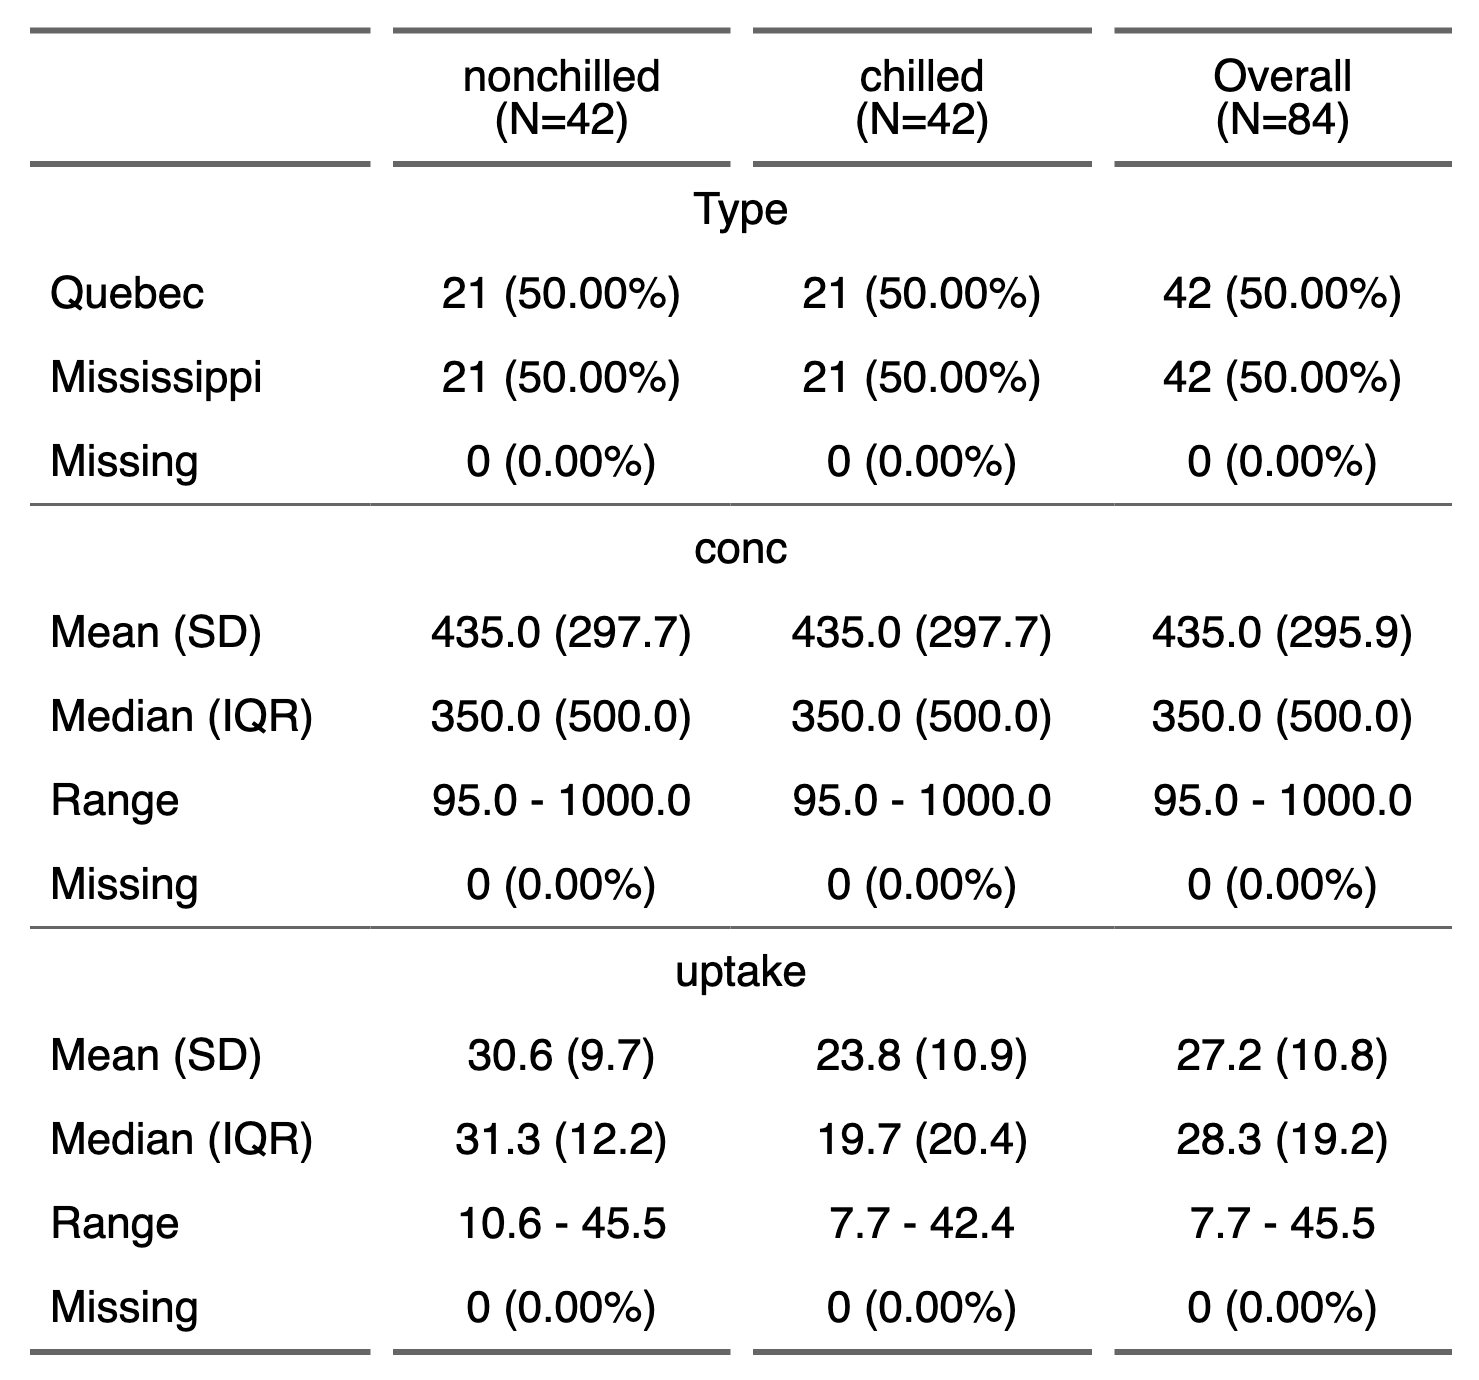
summarizor().
tabulator().