Our posts tagged 'flextable'
What's new in flextable 0.9.11
flextable 0.9.11 brings ‘patchwork’ integration to combine tables with plots and Quarto markdown support inside cells with
as_qmd().
2026/02/17
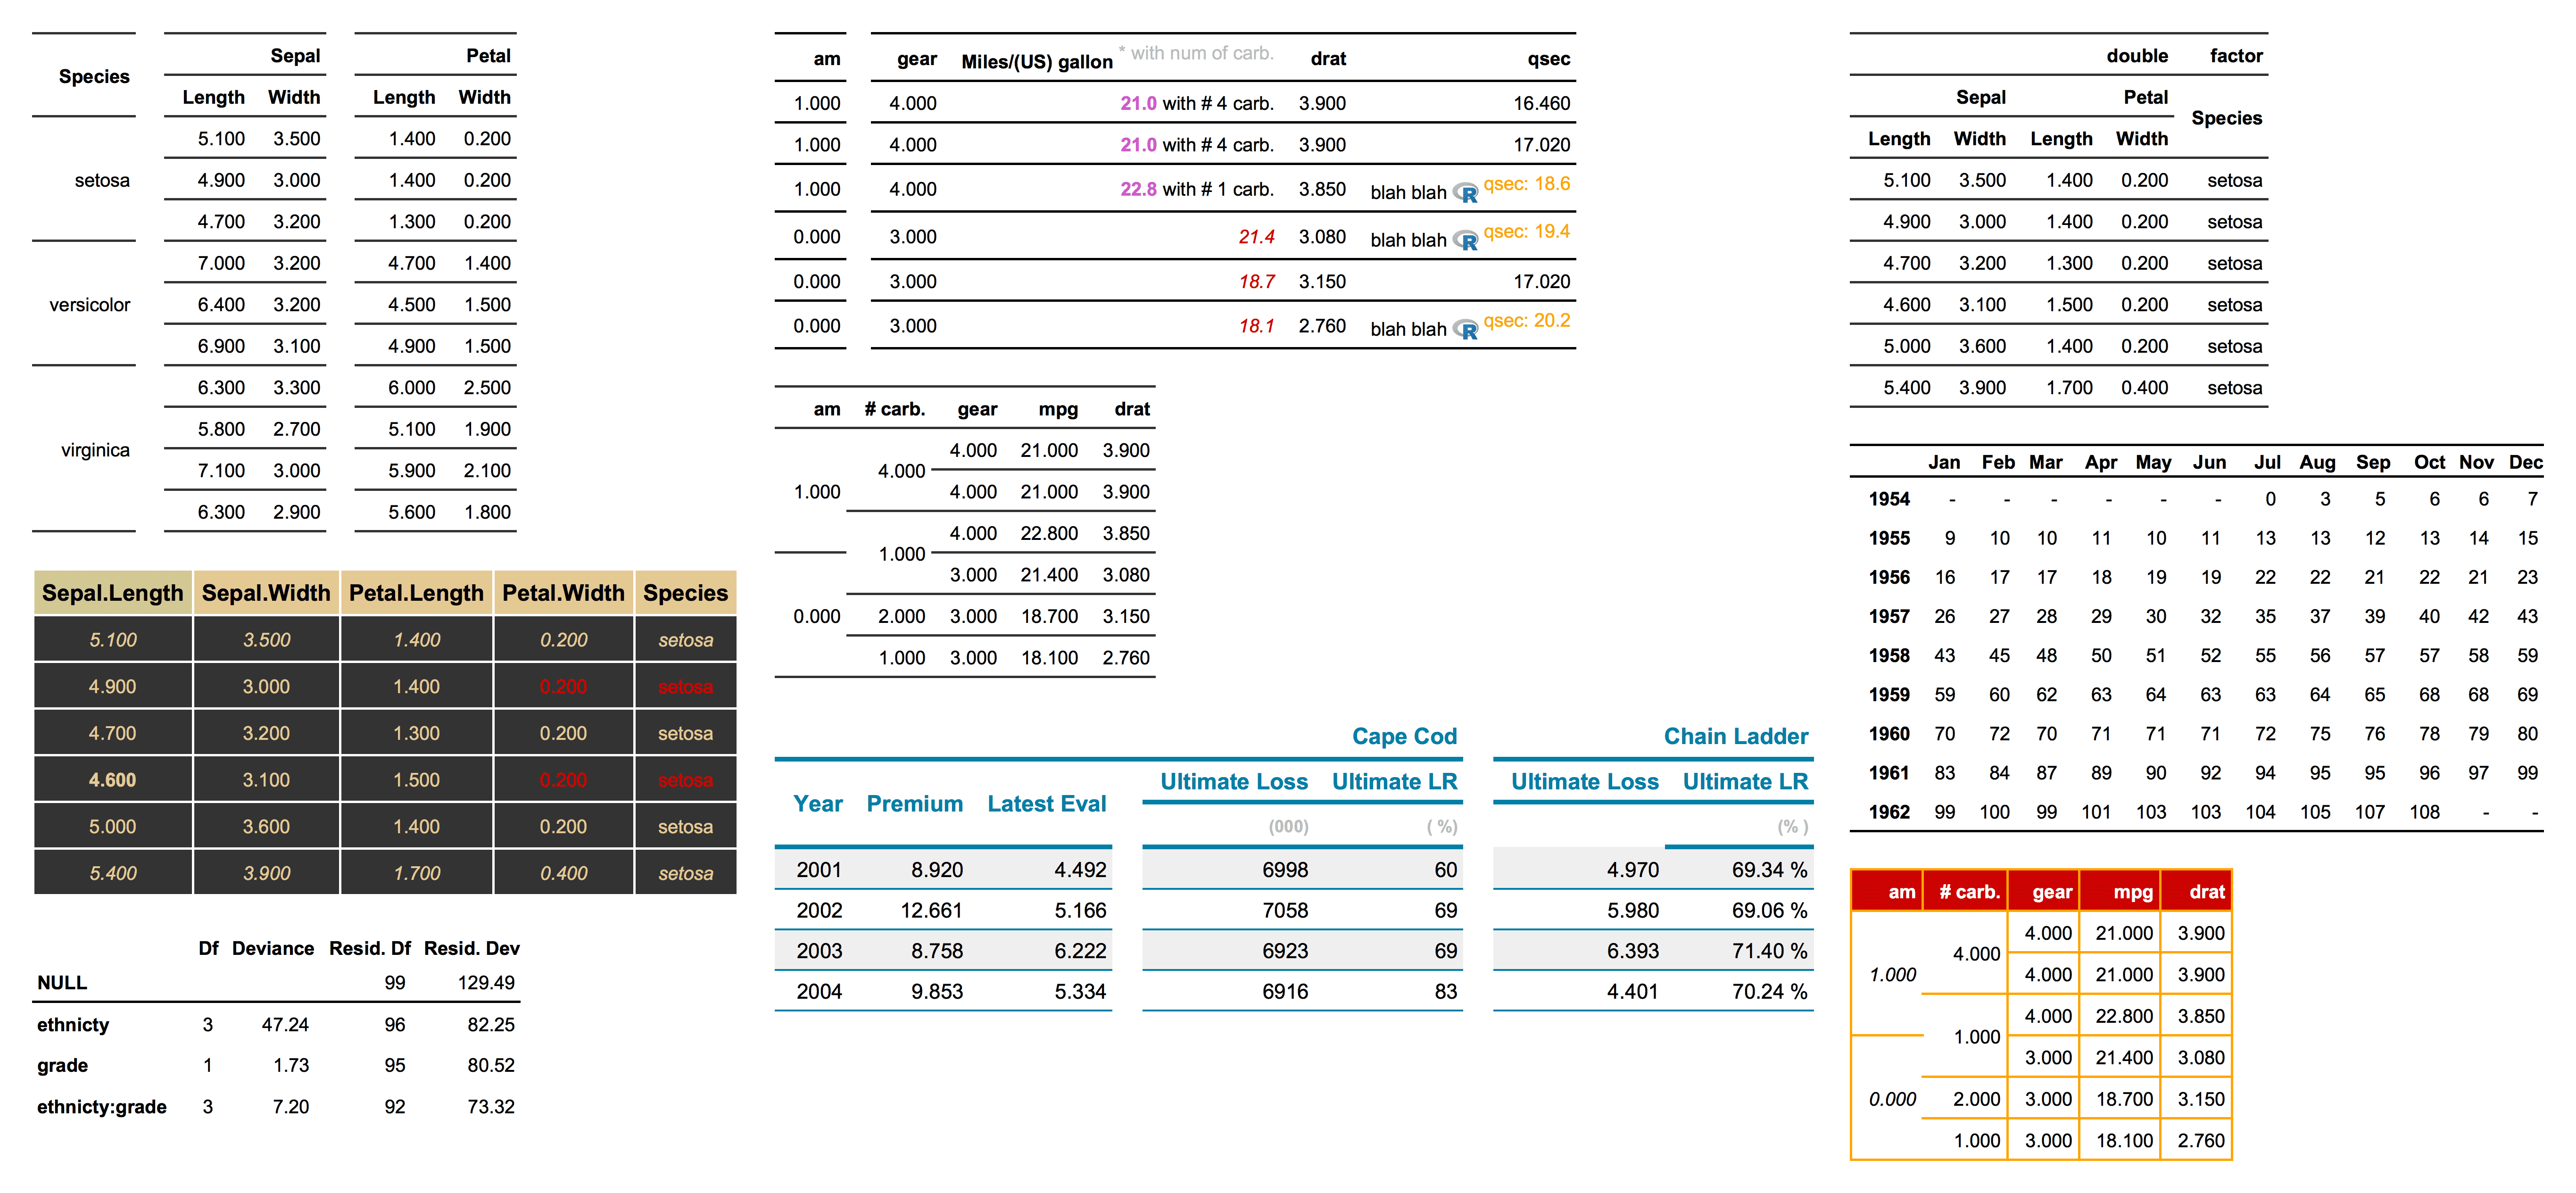
tabular and flextable
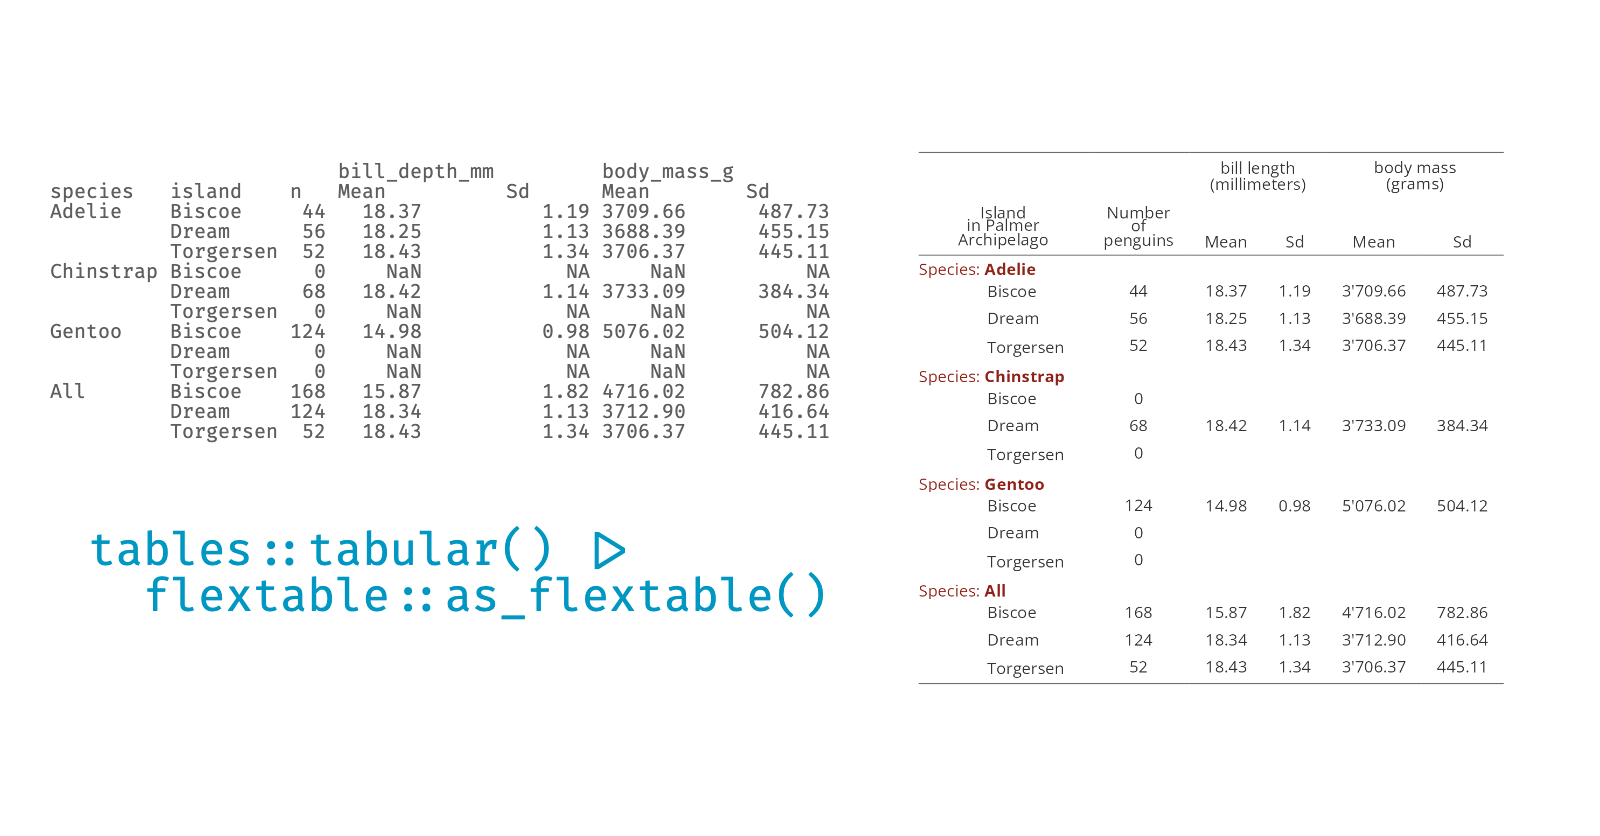
tables::tabular() is the closest thing to the PROC TABULATE in the current R ecosystem. The as_flextable() function of the ‘flextable’ package allows you to obtain a table from the result of tables::tabular() which can then be formatted and integrated into a document of your choice.
2023/04/07
flextable supports RTF
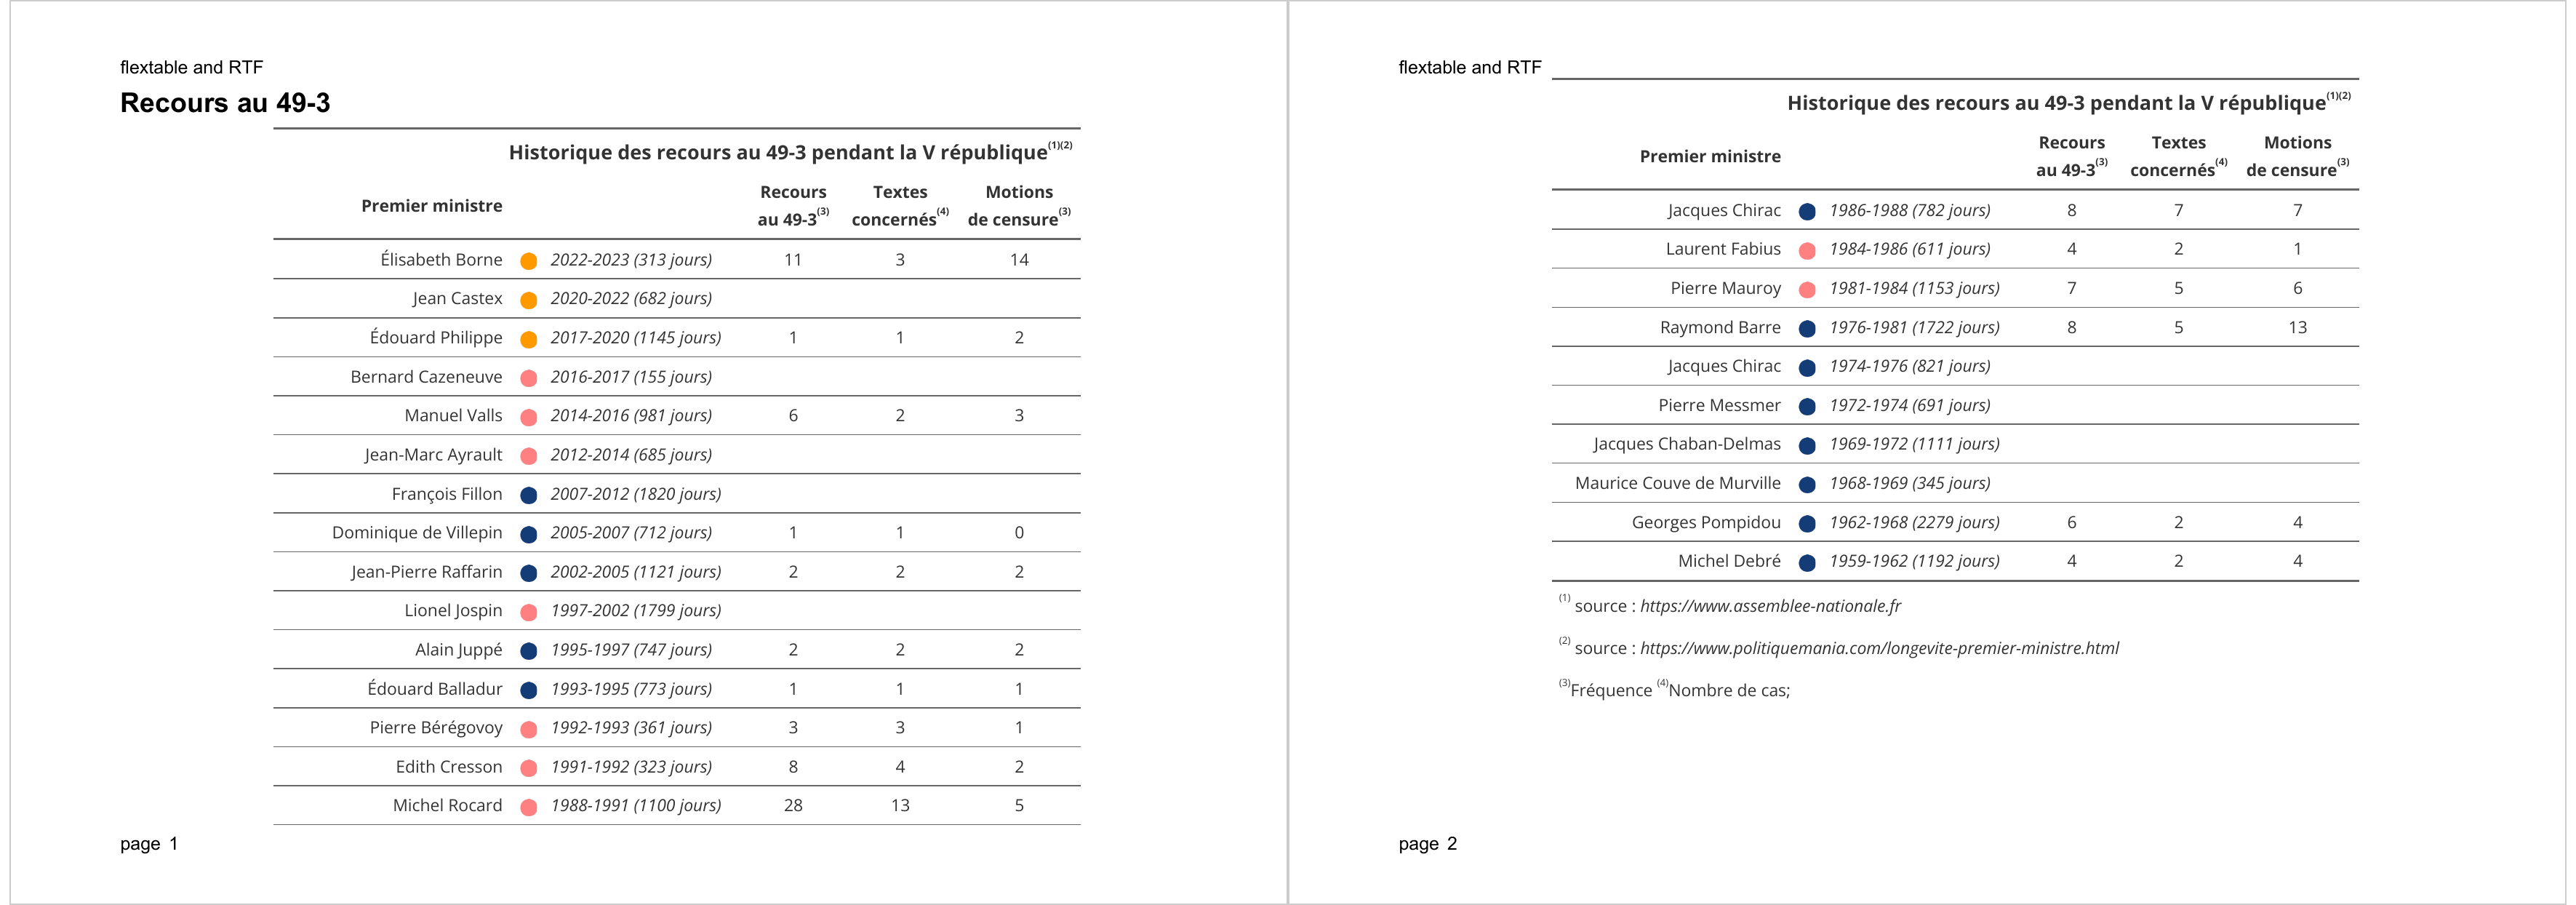
The post presents the new RTF output supported by the ‘flextable’ package and shows an illustrated example.
2023/04/05
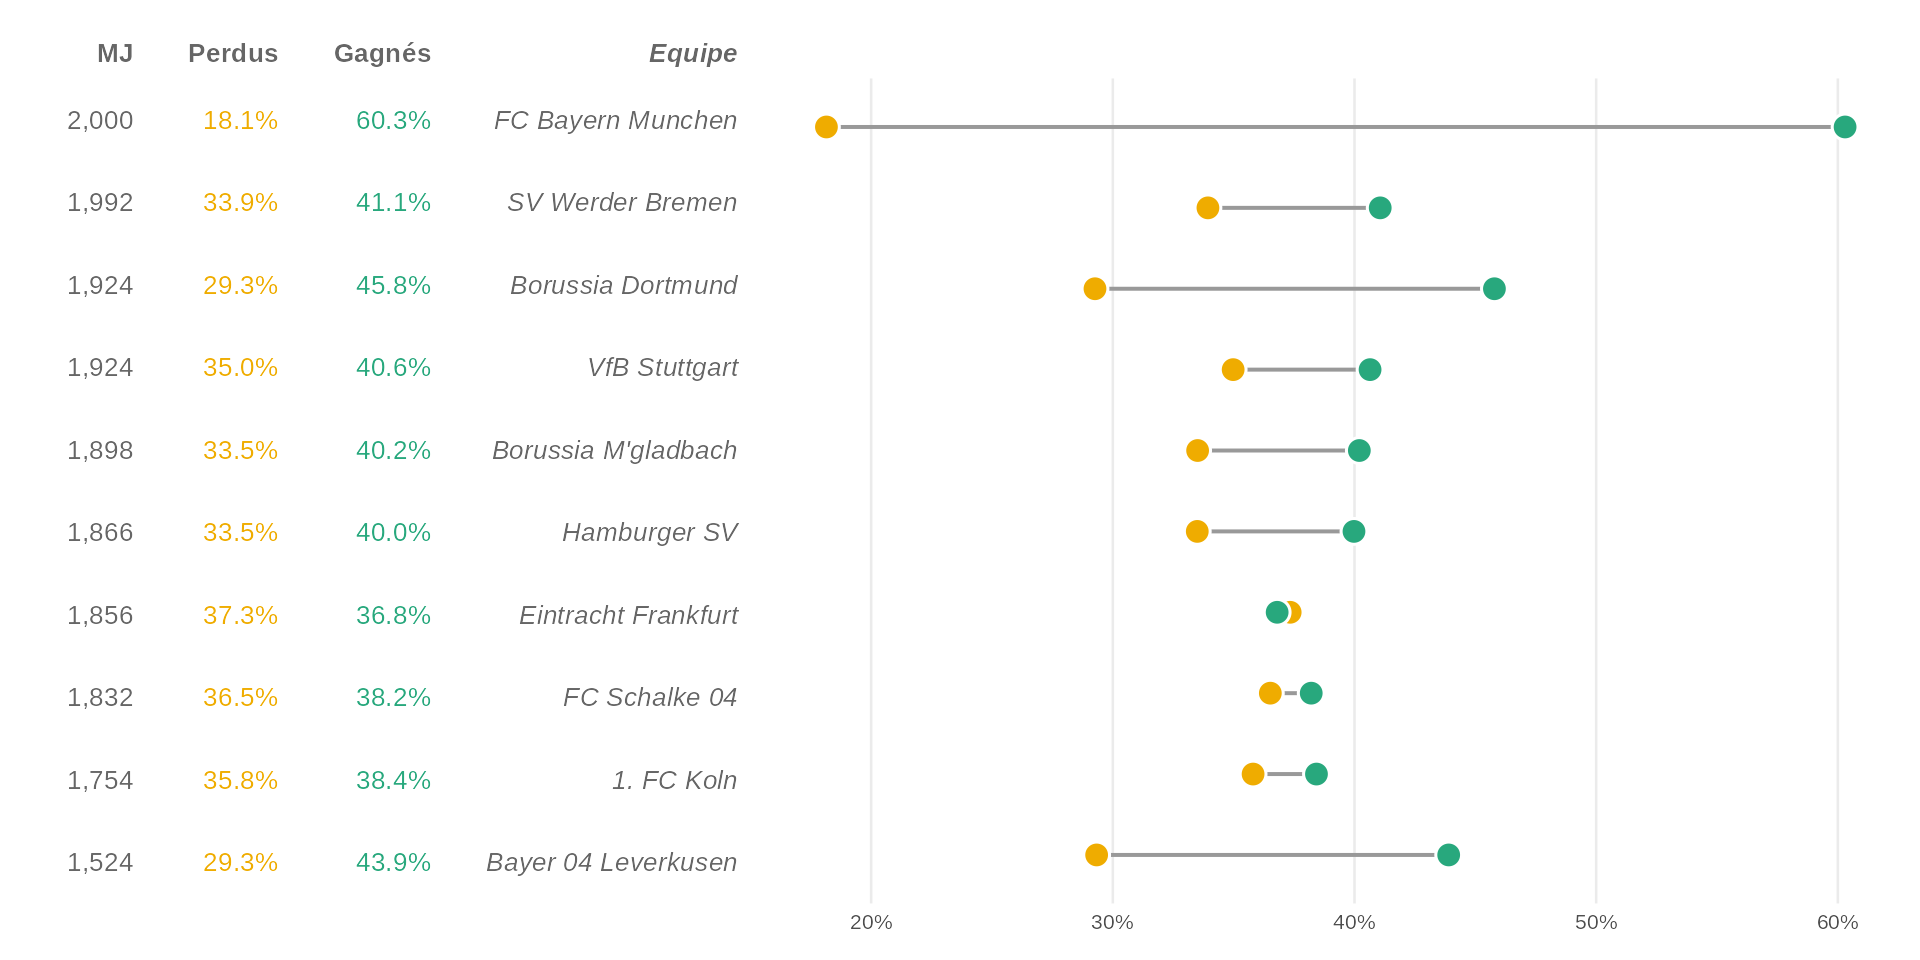
flextable for 'Grid graphics'
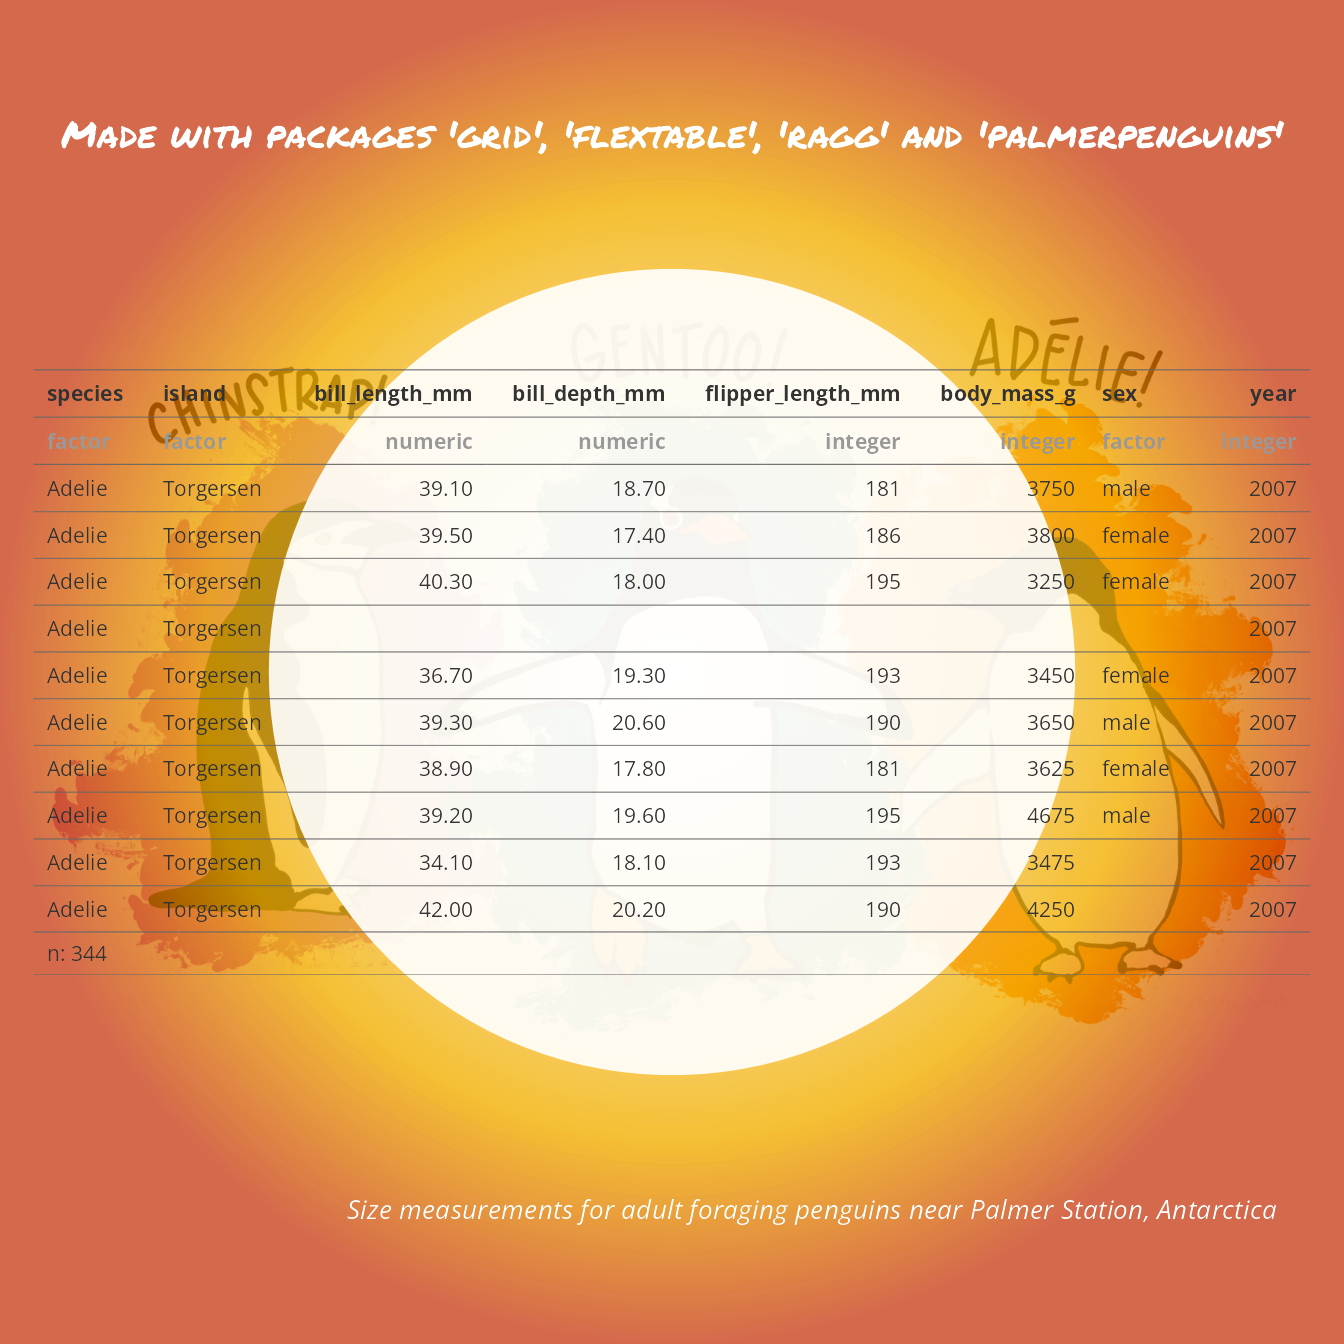
In this article we present the graphic output generated by flextable and how to take advantage of it with ‘ggplot2’ or ‘grid’.
2023/04/03
flextable 0.7.2 is out
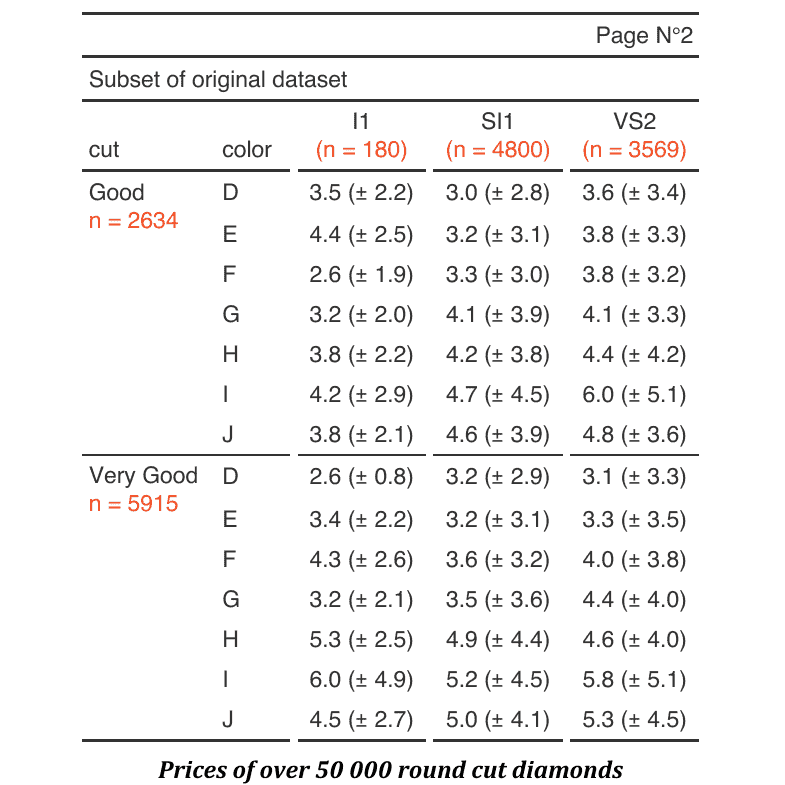
An illustrated summary of the new features of the ‘flextable’ package: how to create crosstabulations of aggregations, how to use flextable for printing data.frame in R Markdown documents and how to split column names into multiple lines.
2022/06/23
Save a flextable as an image
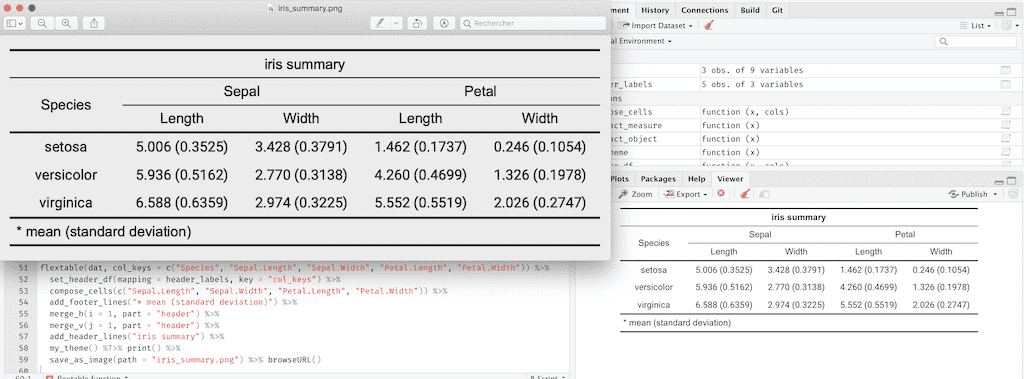
flextable now allows the printing of a table in an image but also in ggplot graphics. This post presents and illustrates these new functionalities.
2019/05/23
flextable 0.4.0 is out
The package flextable is existing since mid 2016 and I did not made any communication about it; obviously if I wrote it, I’d like it to be used by R users! That post is an attempt to fix that.
The flextable package makes it simpler to create tables for reporting purposes. The goal of the package is to provide a set of functions that can be used to design and format tabular reporting.
2018/01/11