One of the great features of the flextable package is the ability to work
with ‘Grid graphics’ format. The gen_grob() function generates a grob
(Graphical Object) from a flextable, which can then be added to a ggplot graphic
using the ‘patchwork’ package or with ggplot2::annotation_custom().
These features require the use of a graphical output using
‘systemfonts’: svglite::svglite(), ragg::agg_png() or ggiraph::dsvg().
These devices must be used to ensure all fonts you are using will be recognized
by the R graphical device.
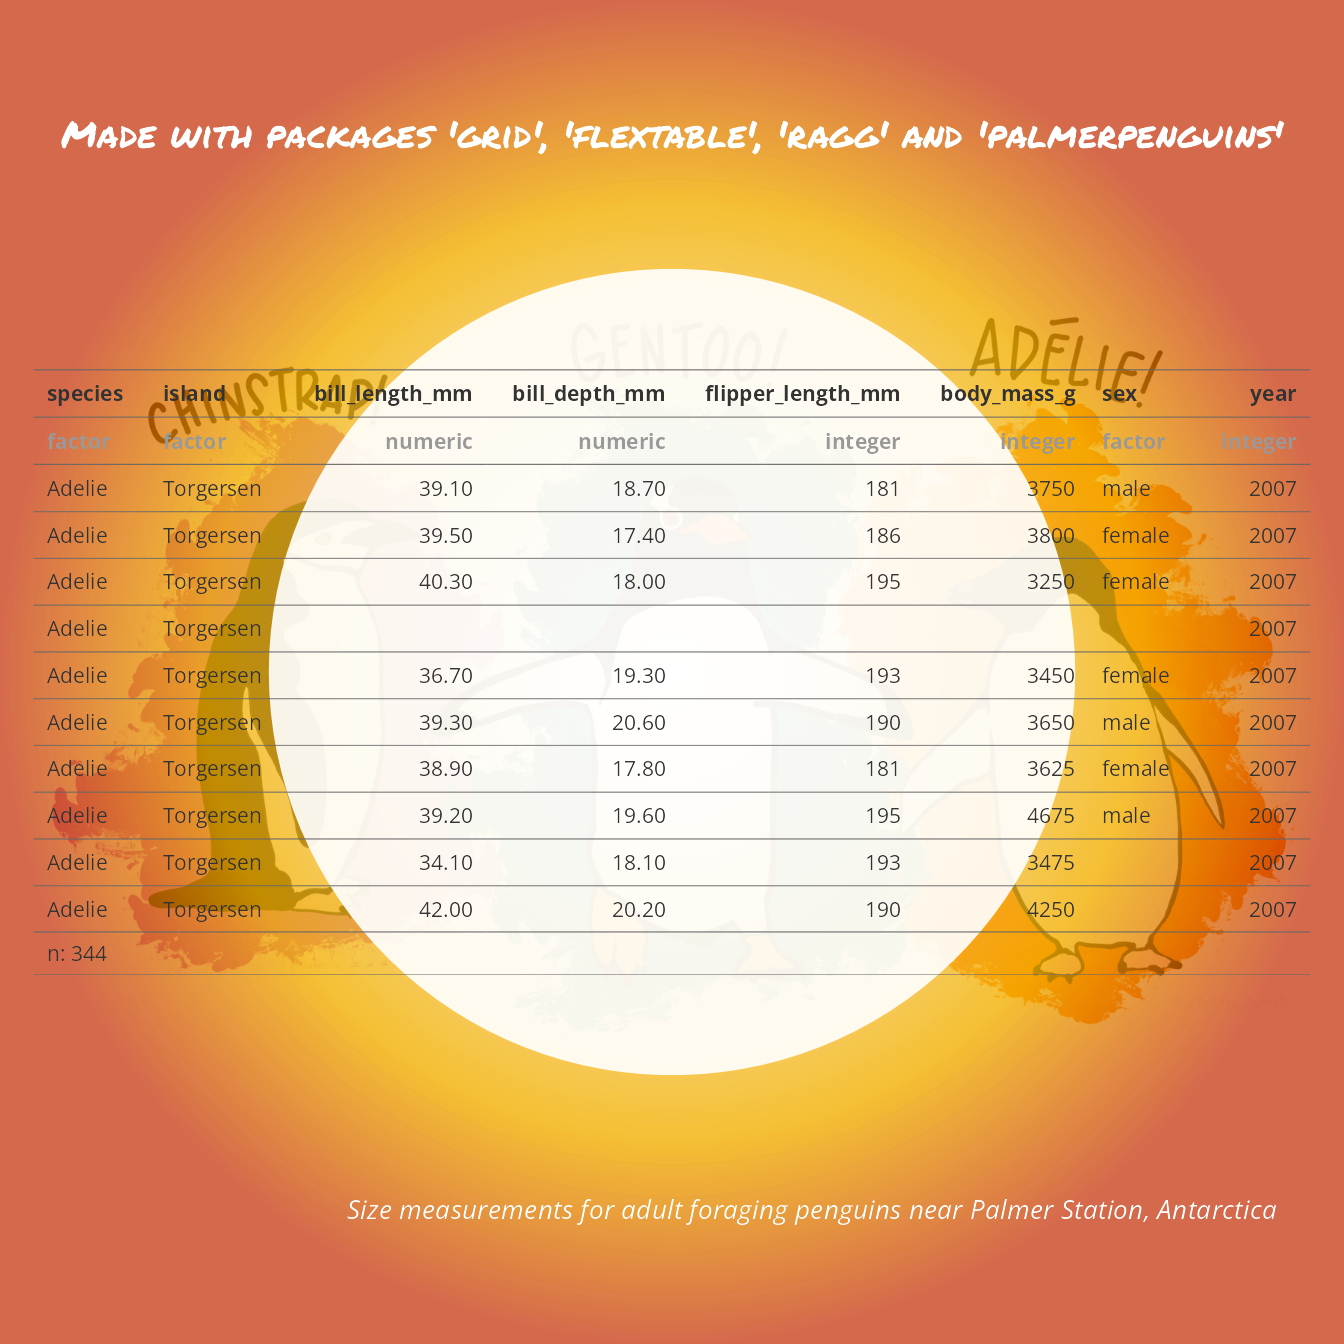
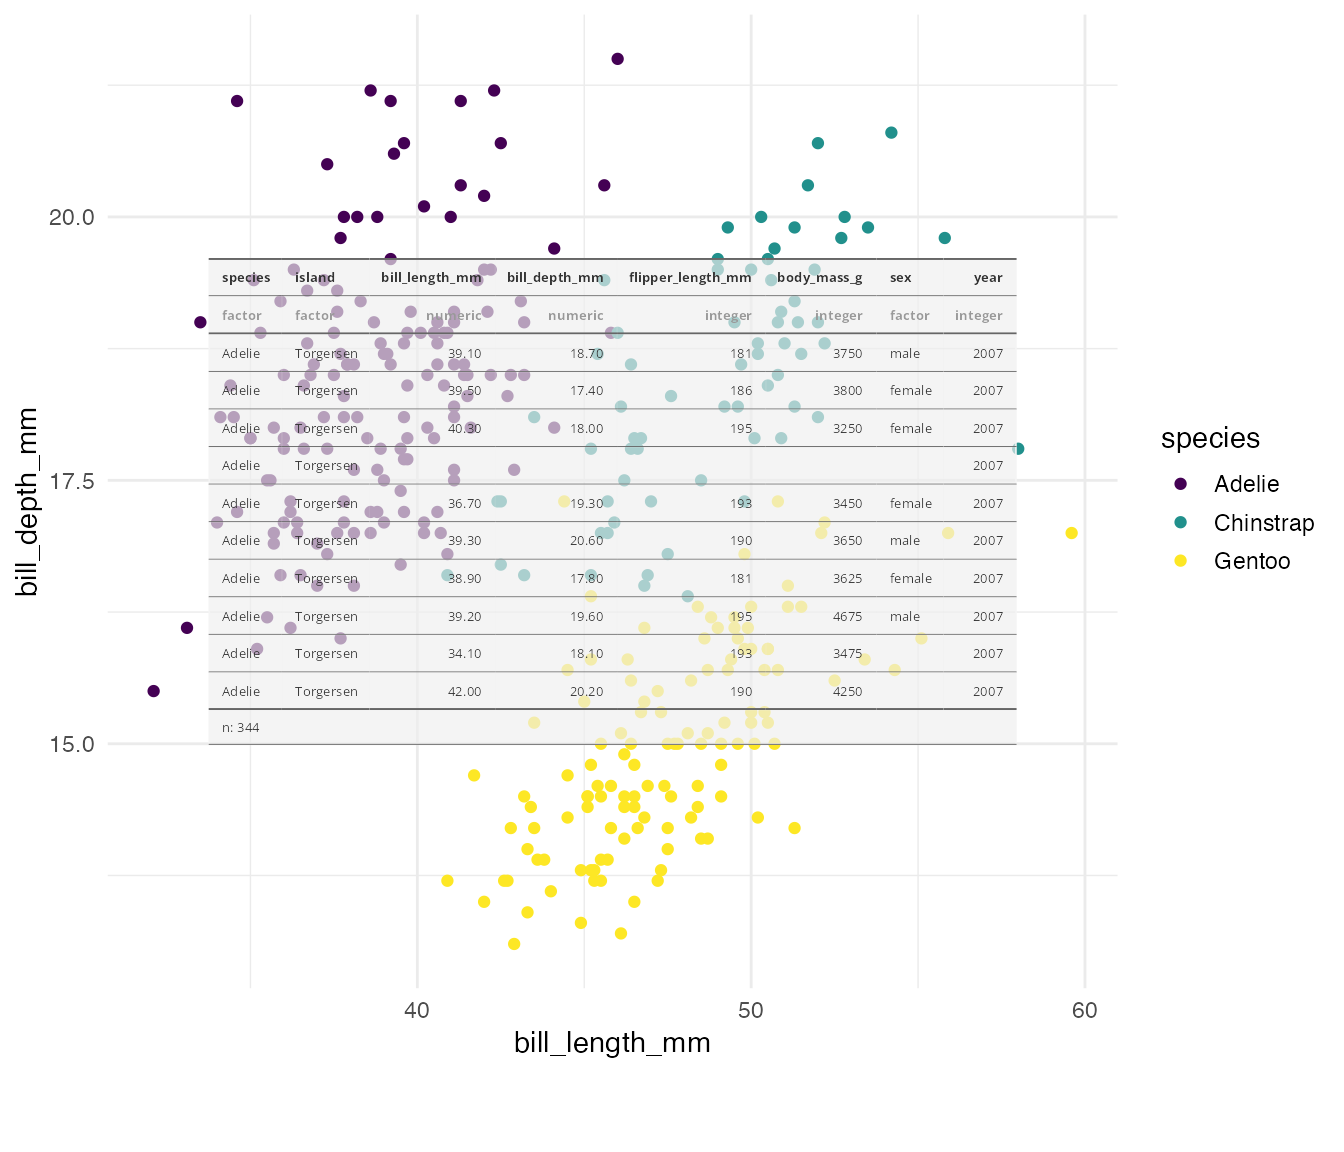
The graph shown above is produced with the function gen_grob().
the associated code is available in this article
of the ‘flextable gallery’.
Export table as png
Past versions of ‘flextable’ used packages ‘webshot’ or ‘webshot2’ to get an image version of the HTML table. This mechanism has been removed and replaced by the use of ‘Grid graphics’ output and the ‘ragg’ package. This allows for a faster process and makes maintenance easier.
First, we define some global parameters.
library(flextable)
library(gdtools)
set_flextable_defaults(
  font.family = "Open Sans", font.color = "#333333",
  theme_fun = theme_vanilla,
  digits = 2, big.mark = "", na_str = "")
register_gfont("Open Sans") # register Open Sans
To export a flextable to a png file, we need to call the save_as_image() function.
Let’s illustrate with an flextable made with the dataset ‘palmerpenguins::penguins’.
library(palmerpenguins)
filename <- "head-penguins.png"
ft <- as_flextable(palmerpenguins::penguins)
save_as_image(ft, path = filename)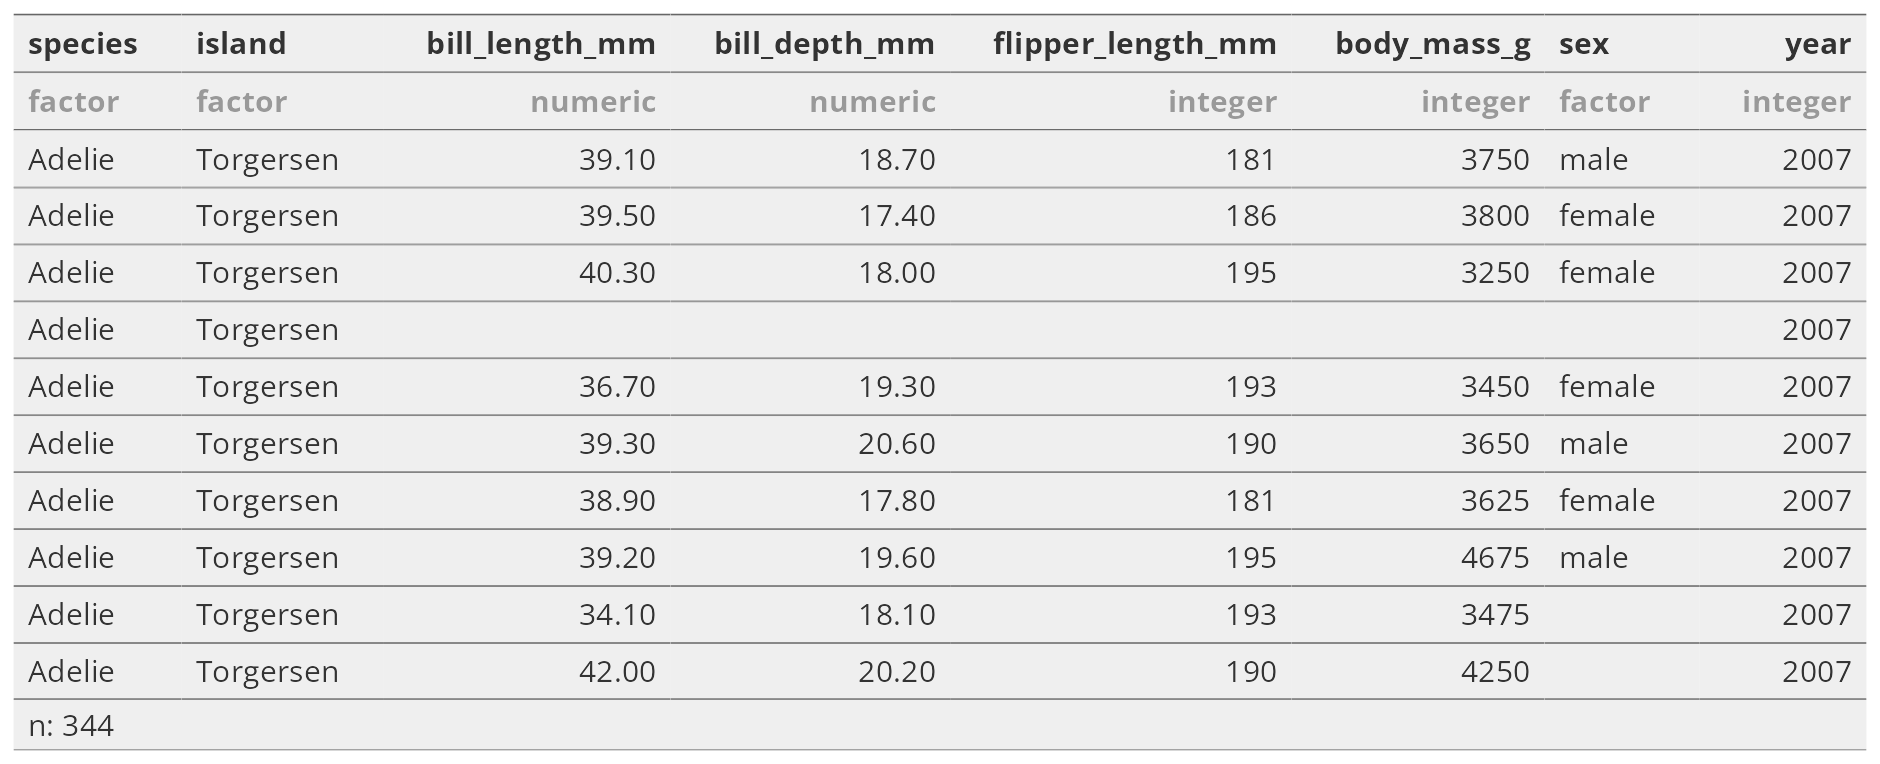
Function gen_grob
Let’s illustrate with the previous ‘flextable’ and a new ‘ggplot’.
library(tidyverse)
g1 <- ggplot(penguins, aes(x = bill_length_mm, y = bill_depth_mm, color = species)) +
  geom_point() +
  scale_color_viridis_d() +
  theme_minimal() +
  theme(plot.margin = unit(c(0, 0, 30, 0), "pt"))
Simple usage
The function gen_grob() will by default adapt to the space available for the table.
library(patchwork)
g1 / gen_grob(ft, just = "bottom")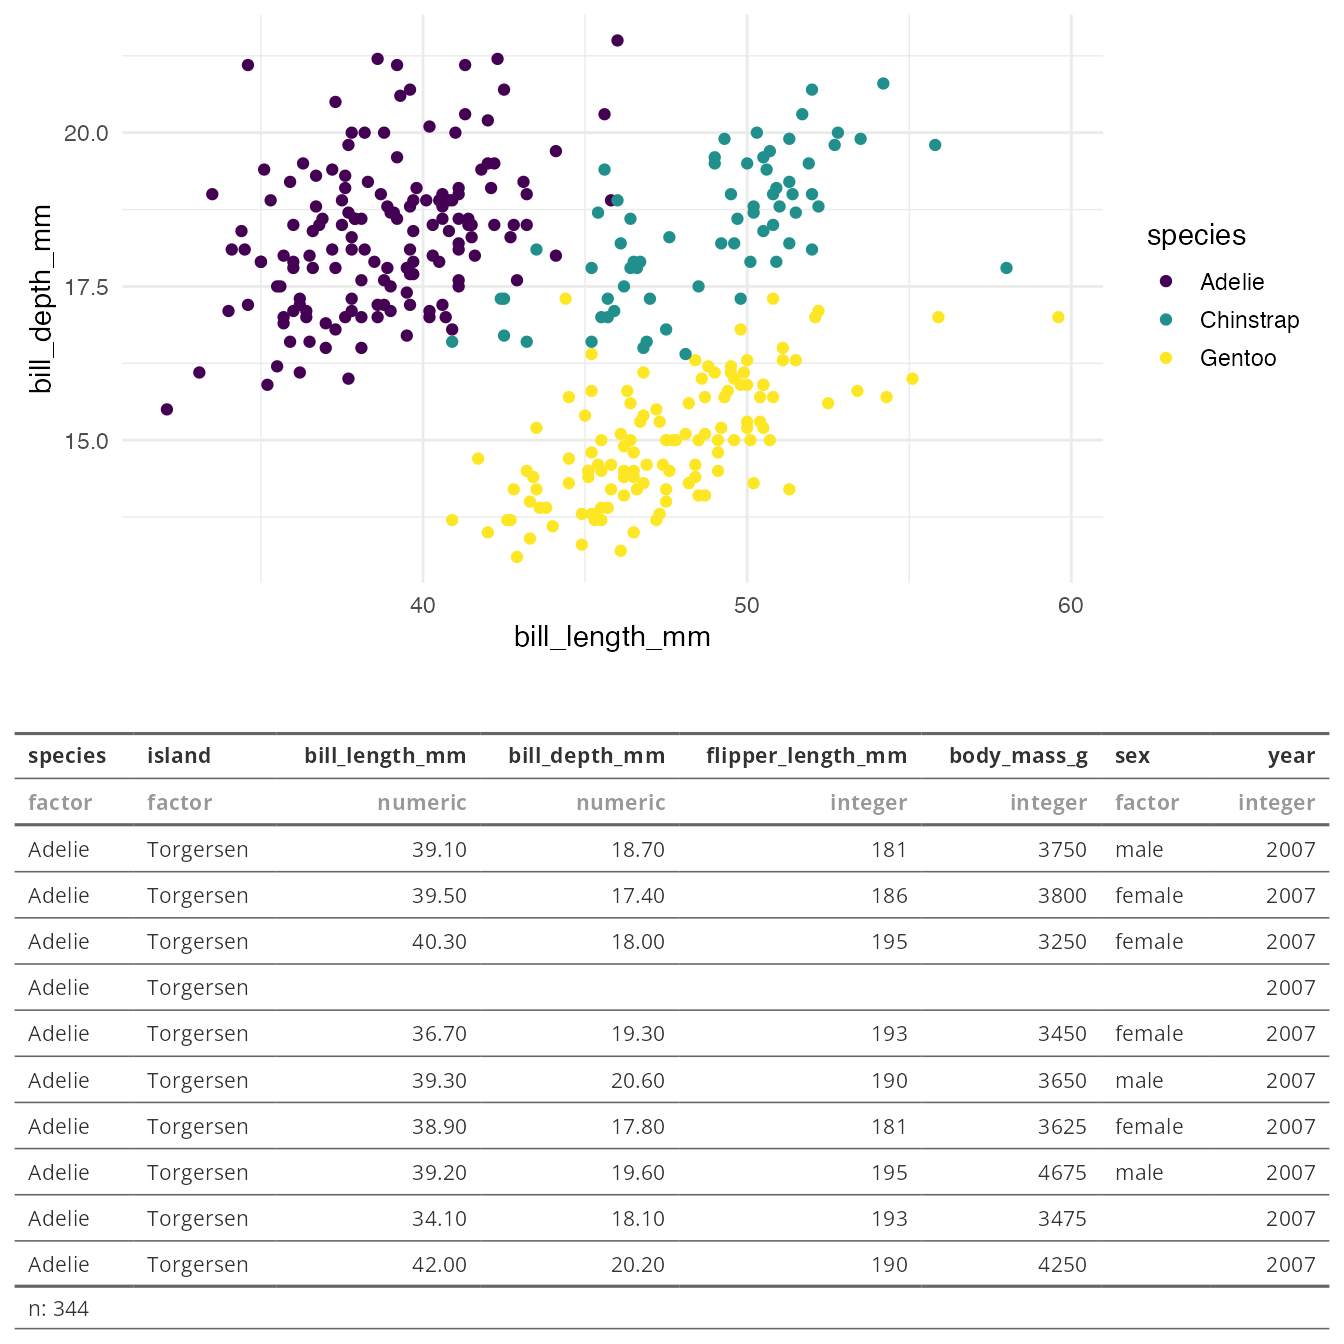
It should work with any function that support grid objects:
g1 +
  inset_element(gen_grob(ft |> bg(bg = "#EFEFEFAA", part = "all"), just = "bottom"), 0.1, 0.25, .9, .75) +
  theme(
    plot.background = element_rect(fill = "transparent"),
    panel.background = element_rect(fill = "transparent")
  )
The resizing options
Of course, it is possible to take control over this automatic resizing.
For this we will use a small table that will help to demo some options.
set_flextable_defaults(font.family = "Fira Sans Condensed")
register_gfont("Fira Sans Condensed")

dummy_ft <- data.frame(zzzz = ";)") |>
  flextable() |>
  color(color = "white", part = "all") |>
  mk_par(
    value = as_paragraph(
      as_chunk("made", props = fp_text_default(font.size = 30, color = "#f2af00")),
      as_chunk(" with\n", props = fp_text_default(color = "gray", font.size = 15)),
      as_chunk("flextable", props = fp_text_default(color = "#c32900", font.size = 45))
    ),
    part = "header") |>
  autofit() |>
  align(align = "center", part = "all") |>
  border_outer(border = fp_border_default(width = 0))
HTML version of the table is the following:
dummy_ftmade with |
|---|
;) |
The graphic below shows some possible resizing options.
- The first table will be sized to fit the available width (
fit = "width") and the fonts will be resized to the maximum possible (scaling = "full"). - The second table is displayed with no resizing (
fit = "fixed"). - The last table is displayed using the maximum possible size (
fit = "auto").
design <- "AAA
           BBC"
wrap_plots(
  dummy_ft |>
    bg(bg = "#ff006e", part = "all") |>
    gen_grob(fit = "width", scaling = "full", just = "bottom"),
  dummy_ft |>
    bg(bg = "#3a86ff", part = "all") |>
    gen_grob(fit = "fixed"),
  dummy_ft |> bg(bg = "#ffbe0b", part = "all") |> gen_grob(),
  design = design
)
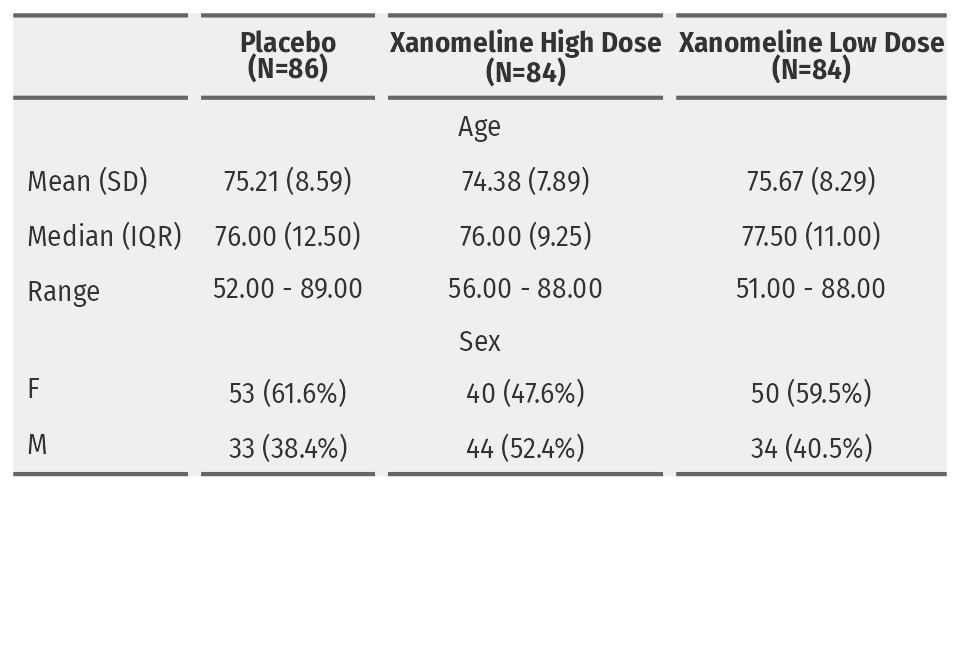
Content wrapping
An algorithm is used to wrap content within the available space of the cell.
library(safetyData)

adsl <- adam_adsl[, c("AGE", "SEX", "ARM")]

dat <- summarizor(adsl, by = "ARM")
ft <- as_flextable(dat, spread_first_col = TRUE)
ft |> bg(bg = "#EFEFEF", part = "all") |>
  plot(fit = "width", wrapping = TRUE, scaling = FALSE)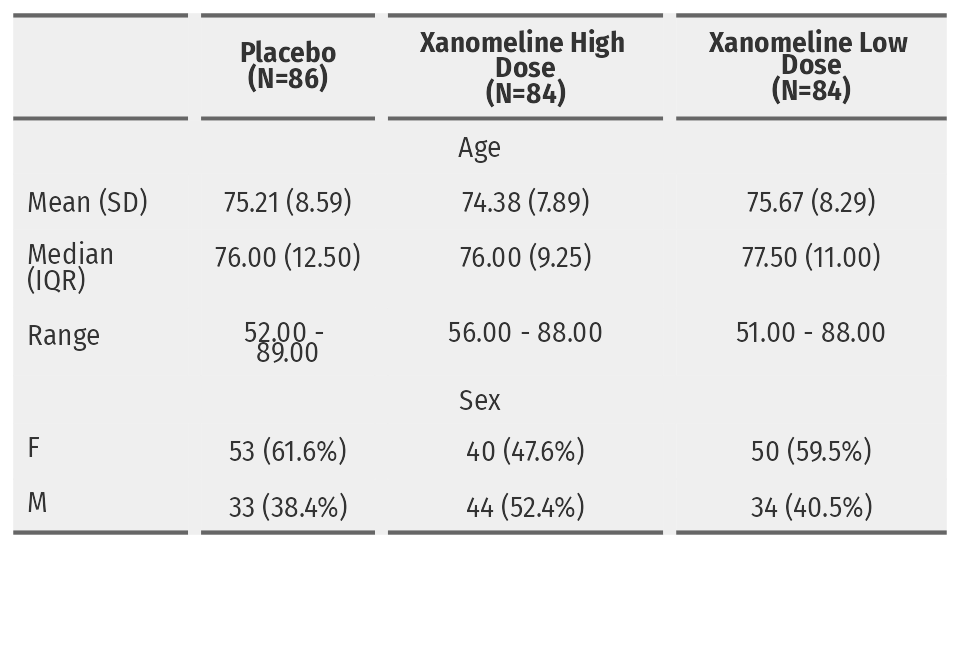
It can be disabled with the wrapping = FALSE argument.
ft |> bg(bg = "#EFEFEF", part = "all") |>
  plot(fit = "width", wrapping = FALSE, scaling = FALSE)