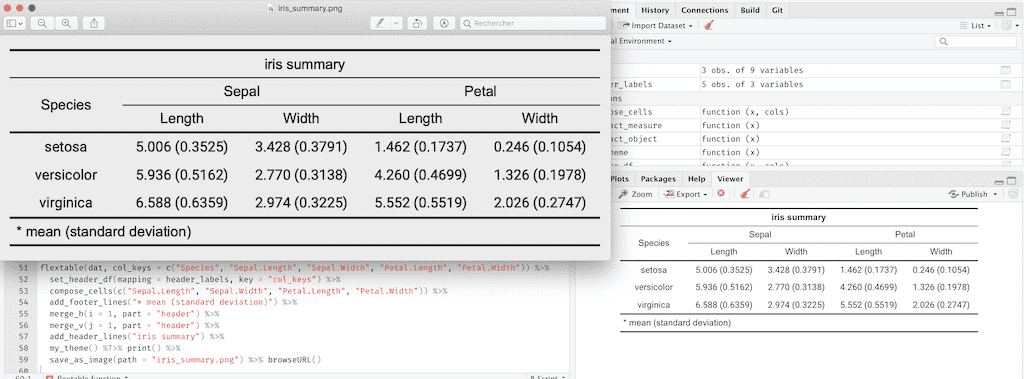
flextable 0.5.4 is now on CRAN. It contains a new output option that some users were asking: image output. You can now save a flextable as a png or pdf file with function save_as_image.
The solution was existing since a long time but was buried in a stackoverflow question instead of being provided in flextable as an option.
This functionality is letting other options to be available, you can now use method plot and also as_raster and do whatever you’d like with the raster (combine with a ggplot object for example).
Demo
First, let’s create a simple flextable.
library(flextable)
ft <- flextable(head(mtcars))
ft <- autofit(ft)
ftmpg | cyl | disp | hp | drat | wt | qsec | vs | am | gear | carb |
21.0 | 6 | 160 | 110 | 3.90 | 2.620 | 16.46 | 0 | 1 | 4 | 4 |
21.0 | 6 | 160 | 110 | 3.90 | 2.875 | 17.02 | 0 | 1 | 4 | 4 |
22.8 | 4 | 108 | 93 | 3.85 | 2.320 | 18.61 | 1 | 1 | 4 | 1 |
21.4 | 6 | 258 | 110 | 3.08 | 3.215 | 19.44 | 1 | 0 | 3 | 1 |
18.7 | 8 | 360 | 175 | 3.15 | 3.440 | 17.02 | 0 | 0 | 3 | 2 |
18.1 | 6 | 225 | 105 | 2.76 | 3.460 | 20.22 | 1 | 0 | 3 | 1 |
You can save it as a png:
save_as_image(ft, path = "name.png")You can plot it:
plot(ft)
Or combine the table with a ggplot object:
library(ggplot2)
library(grid)
library(cowplot)

ft_raster <- as_raster(ft)

anyplot <- qplot(speed, dist, data = cars, geom = "point")

gflextable <- ggplot() +
  theme_void() +
  annotation_custom(rasterGrob(ft_raster),
    xmin = -Inf, xmax = Inf, ymin = -Inf, ymax = Inf
  )

plot_grid(anyplot, gflextable, nrow = 2, ncol = 1, rel_heights = c(4, 1))
About width and height
When a flextable is printed, it may be useful to know the exact width and height
of the table to be sure to set up the correct aspect ratio. The function
flextable_dim() will provide these informations without the need to produce
the image.
dims <- flextable_dim(ft)
dims
#> $widths
#> [1] 6.186252
#>
#> $heights
#> [1] 2.800021
#>
#> $aspect_ratio
#> [1] 0.4526199You can reuse them as values for knitr chunk options fig.asp, fig.width and fig.height.
Follow us: - Recommanded sites: R-bloggers R weekly Twitter #rstats Jobs for R-users
