The package ‘flextable’ (Gohel and Skintzos 2023) provides a method as_flextable() to benefit from
table objects created with package ‘tables’ (Murdoch 2023).
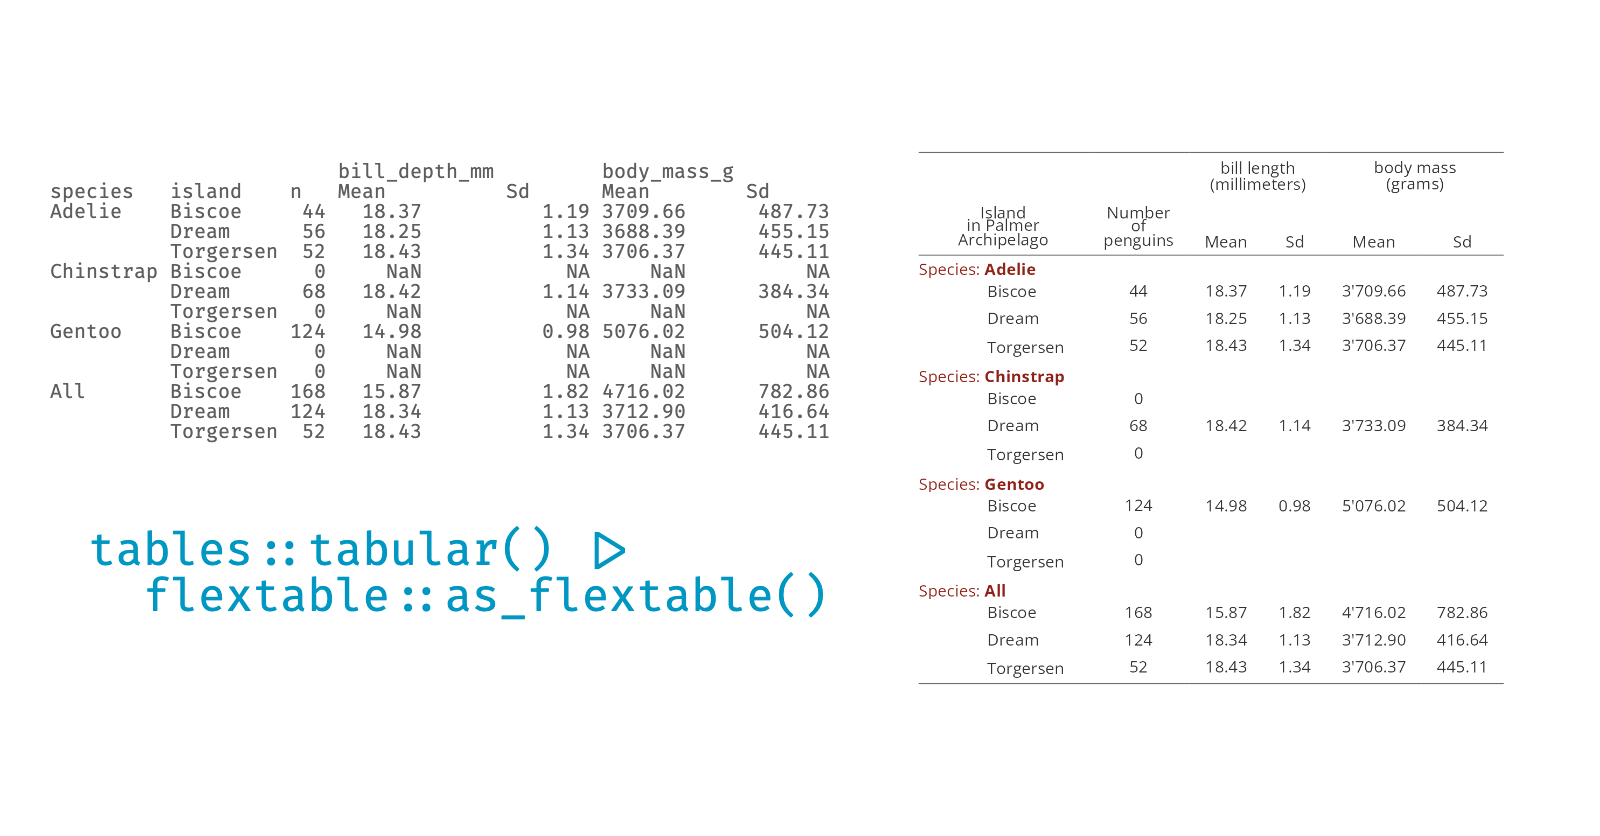
Function tables::tabular() is a powerful tool that let users easily
create simple and complex cross tables. Function as_flextable() is simple to use, it
transforms ‘tables’ objects into ‘flextable’ objects and let you
enrich the table with extra information and or formats.
The goal of package ‘tables’ is to compute and display complex tables of summary statistics. It is described by his author as:
The tables package provides a formula-driven interface for computing the contents of tables and formatting them. It was inspired by SAS PROC TABULATE, but is not compatible with it.
The user computes a table object by specifying a formula, with the left-hand side giving the rows, and the right-hand side giving the columns; the formula describes the summary functions to apply and how to organize them. […]
The combination of these two packages offers the possibility to create cross tabulations very easily, to stack or filter them and then to format them with flextable and to benefit from a whole range of formatting functionalities as well as the possibility to export them in the output formats supported by ‘flextable’.
tabular example
Let’s create an crosstable of aggregations based on
the penguins dataset provided by package ‘palmerpenguins’ (Horst, Hill, and Gorman 2022):
library(tables)
library(palmerpenguins)

Mean <- function(x) mean(x, na.rm = TRUE)

Sd <- function(x) sd(x, na.rm = TRUE)

tab <- tabular(
  table = (species + 1) * island ~
    (n = 1) + Format(digits = 2) *
      (bill_depth_mm + body_mass_g) * (Mean + Sd),
  data = penguins)
print(tab)
#>
#> bill_depth_mm body_mass_g
#> species island n Mean Sd Mean Sd
#> Adelie Biscoe 44 18.37 1.19 3709.66 487.73
#> Dream 56 18.25 1.13 3688.39 455.15
#> Torgersen 52 18.43 1.34 3706.37 445.11
#> Chinstrap Biscoe 0 NaN NA NaN NA
#> Dream 68 18.42 1.14 3733.09 384.34
#> Torgersen 0 NaN NA NaN NA
#> Gentoo Biscoe 124 14.98 0.98 5076.02 504.12
#> Dream 0 NaN NA NaN NA
#> Torgersen 0 NaN NA NaN NA
#> All Biscoe 168 15.87 1.82 4716.02 782.86
#> Dream 124 18.34 1.13 3712.90 416.64
#> Torgersen 52 18.43 1.34 3706.37 445.11turn it to a flextable
A simple call to as_flextable() produces a flextable
quite similar to the tabular outputs:
as_flextable(tab)species | island | bill_depth_mm | body_mass_g | |||
|---|---|---|---|---|---|---|
n | Mean | Sd | Mean | Sd | ||
Adelie | Biscoe | 44 | 18.37 | 1.19 | 3709.66 | 487.73 |
Dream | 56 | 18.25 | 1.13 | 3688.39 | 455.15 | |
Torgersen | 52 | 18.43 | 1.34 | 3706.37 | 445.11 | |
Chinstrap | Biscoe | 0 | NaN | NA | NaN | NA |
Dream | 68 | 18.42 | 1.14 | 3733.09 | 384.34 | |
Torgersen | 0 | NaN | NA | NaN | NA | |
Gentoo | Biscoe | 124 | 14.98 | 0.98 | 5076.02 | 504.12 |
Dream | 0 | NaN | NA | NaN | NA | |
Torgersen | 0 | NaN | NA | NaN | NA | |
All | Biscoe | 168 | 15.87 | 1.82 | 4716.02 | 782.86 |
Dream | 124 | 18.34 | 1.13 | 3712.90 | 416.64 | |
Torgersen | 52 | 18.43 | 1.34 | 3706.37 | 445.11 | |
It uses flextable default settings when possible, we recommended to define them once per session.
set_flextable_defaults(
    font.family = "Open Sans",
    font.color = "#333333",
    digits = 2,
    big.mark = "'",
    na_str = "", nan_str = "",
    theme_fun = theme_booktabs)
‘tables’ comes with many options that can be used to format the table. The flextable transformation preserves column types, it makes easier to post format the table with flextable syntax if needed:
as_flextable(tab) |>
  colformat_double() |>
  theme_vanilla()
species | island | bill_depth_mm | body_mass_g | |||
|---|---|---|---|---|---|---|
n | Mean | Sd | Mean | Sd | ||
Adelie | Biscoe | 44 | 18.37 | 1.19 | 3'709.66 | 487.73 |
Dream | 56 | 18.25 | 1.13 | 3'688.39 | 455.15 | |
Torgersen | 52 | 18.43 | 1.34 | 3'706.37 | 445.11 | |
Chinstrap | Biscoe | 0 | ||||
Dream | 68 | 18.42 | 1.14 | 3'733.09 | 384.34 | |
Torgersen | 0 | |||||
Gentoo | Biscoe | 124 | 14.98 | 0.98 | 5'076.02 | 504.12 |
Dream | 0 | |||||
Torgersen | 0 | |||||
All | Biscoe | 168 | 15.87 | 1.82 | 4'716.02 | 782.86 |
Dream | 124 | 18.34 | 1.13 | 3'712.90 | 416.64 | |
Torgersen | 52 | 18.43 | 1.34 | 3'706.37 | 445.11 | |
Use row separator
Groups’ separators can be defined as rows instead of a first column in order to reduce the width of the table:
as_flextable(tab, spread_first_col = TRUE) |>
  colformat_double()
island | bill_depth_mm | body_mass_g | |||
|---|---|---|---|---|---|
n | Mean | Sd | Mean | Sd | |
Adelie | |||||
Biscoe | 44 | 18.37 | 1.19 | 3'709.66 | 487.73 |
Dream | 56 | 18.25 | 1.13 | 3'688.39 | 455.15 |
Torgersen | 52 | 18.43 | 1.34 | 3'706.37 | 445.11 |
Chinstrap | |||||
Biscoe | 0 | ||||
Dream | 68 | 18.42 | 1.14 | 3'733.09 | 384.34 |
Torgersen | 0 | ||||
Gentoo | |||||
Biscoe | 124 | 14.98 | 0.98 | 5'076.02 | 504.12 |
Dream | 0 | ||||
Torgersen | 0 | ||||
All | |||||
Biscoe | 168 | 15.87 | 1.82 | 4'716.02 | 782.86 |
Dream | 124 | 18.34 | 1.13 | 3'712.90 | 416.64 |
Torgersen | 52 | 18.43 | 1.34 | 3'706.37 | 445.11 |
Enrich with flextable
Now let’s add more customizations to illustrate
some other flextable features that fit well with tabular():
- row title formatting with
as_paragraph(), - content tabulation with
prepend_chunks(as_chunk("\t")), - labels update with
labelizor().
ft <- as_flextable(tab, spread_first_col = TRUE,
    row_title = as_paragraph(
      colorize("species: ", color = "#8f2218"),
      colorize(as_b(.row_title), color = "#8f2218")
    )) |>
  colformat_double() |>
  align(j = 1, align = "left") |>
  prepend_chunks(i = ~ .is_row_title %in% FALSE, j = 1, as_chunk("\t")) |>
  labelizor(part = "header", labels = c(bill_depth_mm = "bill length\n(millimeters)",
    body_mass_g = "body mass\n(grams)", island = "Island\nin Palmer\nArchipelago",
    n = "Number\nof\npenguins")) |>
  labelizor(part = "body", labels = stringr::str_to_title) |>
  autofit()
ft
Island | bill length | body mass | |||
|---|---|---|---|---|---|
Number | Mean | Sd | Mean | Sd | |
Species: Adelie | |||||
Biscoe | 44 | 18.37 | 1.19 | 3'709.66 | 487.73 |
Dream | 56 | 18.25 | 1.13 | 3'688.39 | 455.15 |
Torgersen | 52 | 18.43 | 1.34 | 3'706.37 | 445.11 |
Species: Chinstrap | |||||
Biscoe | 0 | ||||
Dream | 68 | 18.42 | 1.14 | 3'733.09 | 384.34 |
Torgersen | 0 | ||||
Species: Gentoo | |||||
Biscoe | 124 | 14.98 | 0.98 | 5'076.02 | 504.12 |
Dream | 0 | ||||
Torgersen | 0 | ||||
Species: All | |||||
Biscoe | 168 | 15.87 | 1.82 | 4'716.02 | 782.86 |
Dream | 124 | 18.34 | 1.13 | 3'712.90 | 416.64 |
Torgersen | 52 | 18.43 | 1.34 | 3'706.37 | 445.11 |
Add into a document
There are simple methods to export a flextable into a document:
save_as_docx(ft, path = "flextable-tabular.docx")
save_as_rtf(ft, path = "flextable-tabular.rtf")
save_as_html(ft, path = "flextable-tabular.html")
save_as_image(ft, path = "flextable-tabular.png")
save_as_pptx(ft, path = "flextable-tabular.pptx")
files can be downloaded here:
- flextable-tabular.docx
- flextable-tabular.html
- flextable-tabular.rtf
- flextable-tabular.png
- flextable-tabular.pptx