The latest version of ‘flextable’ is on CRAN since few days.
This version comes with some major improvements:
- soft returns
\nare now supported inautofit(), - the HTML rendering of vertically oriented text is now correct and consistent with horizontal alignments,
- tabs
\tand soft returns\nare now correctly handled in PowerPoint, - it is now possible to place a same reference to a footnote several times.
- the PDF rendering allows three placement options, fixed, float and wrap.
It also contains some new features that we are happy to introduce in this post.
tabulator
This new function prepares aggregations in a layout that can be turned into
a nice flextable. The objective is to provide a tool to allow the creation
of reporting tables where dimensions are arranged in rows and columns and
where one or more statistics are displayed in the cell contents.
‘flextable’ grammar can be used to customize the table generated with
comamnd flextable::as_flextable().
The function will create this table from already calculated aggregations.
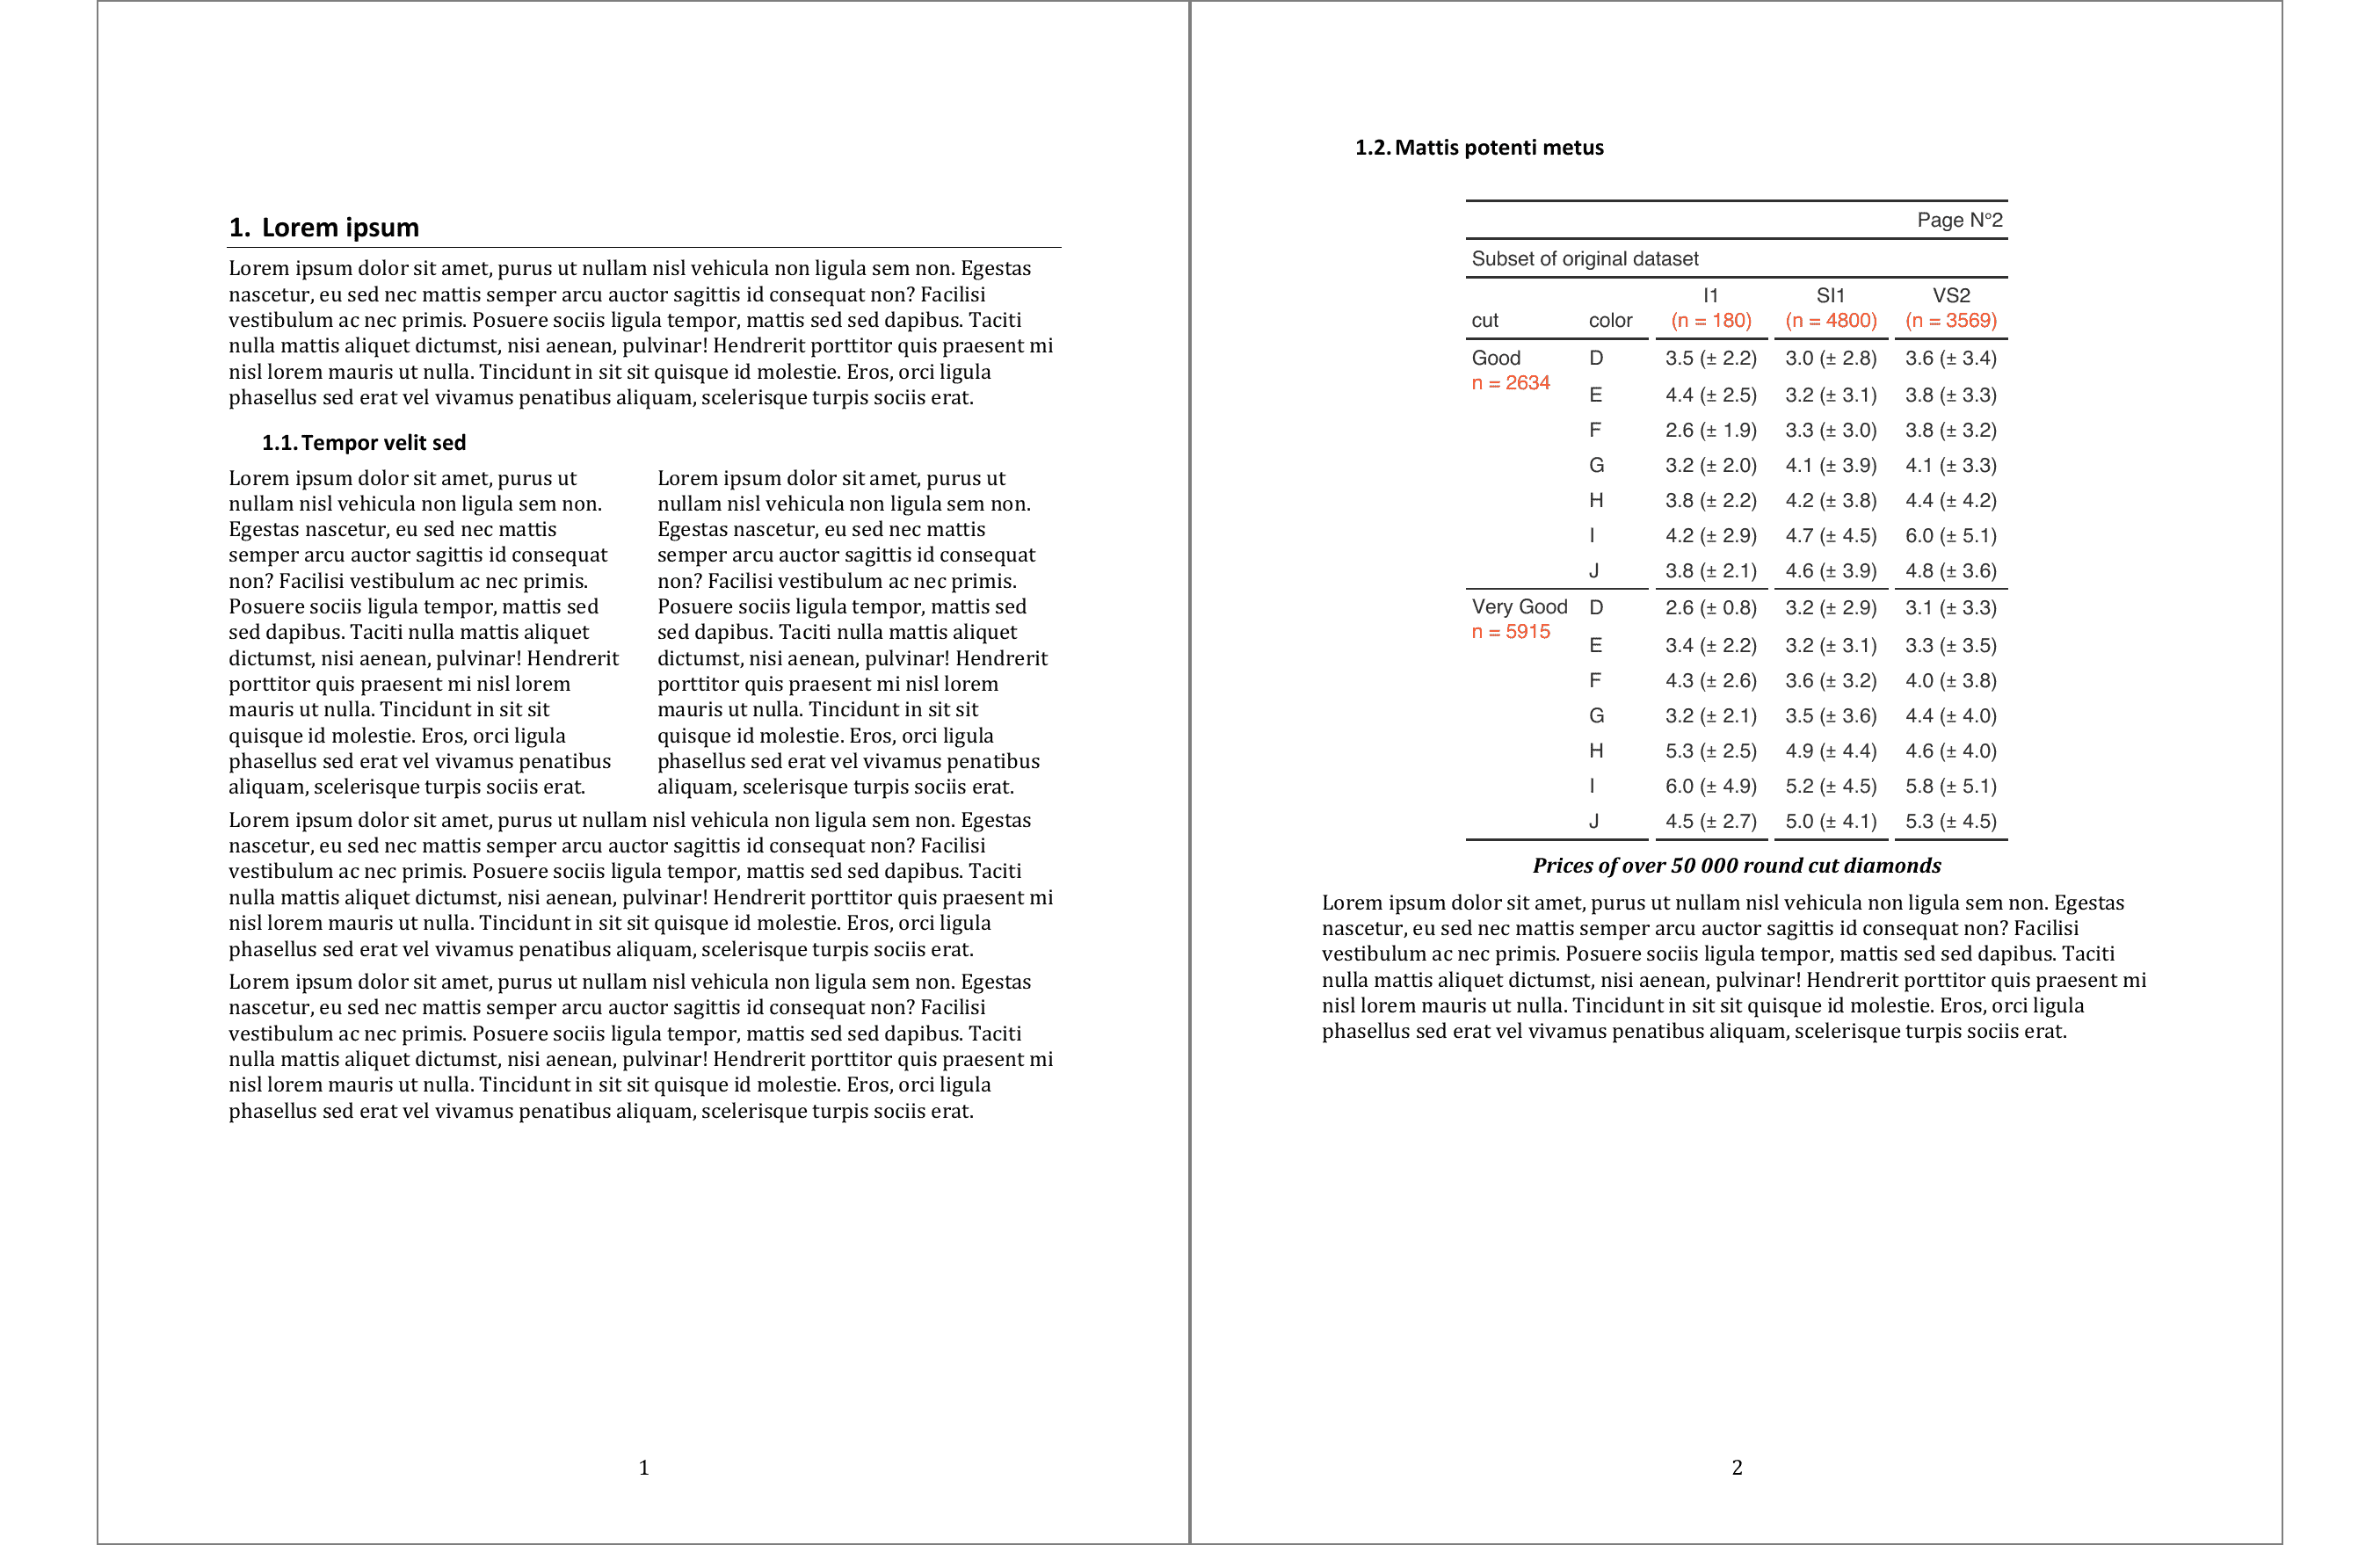
Subset of original dataset | |||||||
cut | color | I1 | SI1 | VS2 | |||
Good | D | 3.5 (± 2.2) | 3.0 (± 2.8) | 3.6 (± 3.4) | |||
E | 4.4 (± 2.5) | 3.2 (± 3.1) | 3.8 (± 3.3) | ||||
F | 2.6 (± 1.9) | 3.3 (± 3.0) | 3.8 (± 3.2) | ||||
G | 3.2 (± 2.0) | 4.1 (± 3.9) | 4.1 (± 3.3) | ||||
H | 3.8 (± 2.2) | 4.2 (± 3.8) | 4.4 (± 4.2) | ||||
I | 4.2 (± 2.9) | 4.7 (± 4.5) | 6.0 (± 5.1) | ||||
J | 3.8 (± 2.1) | 4.6 (± 3.9) | 4.8 (± 3.6) | ||||
Very Good | D | 2.6 (± 0.8) | 3.2 (± 2.9) | 3.1 (± 3.3) | |||
E | 3.4 (± 2.2) | 3.2 (± 3.1) | 3.3 (± 3.5) | ||||
F | 4.3 (± 2.6) | 3.6 (± 3.2) | 4.0 (± 3.8) | ||||
G | 3.2 (± 2.1) | 3.5 (± 3.6) | 4.4 (± 4.0) | ||||
H | 5.3 (± 2.5) | 4.9 (± 4.4) | 4.6 (± 4.0) | ||||
I | 6.0 (± 4.9) | 5.2 (± 4.5) | 5.8 (± 5.1) | ||||
J | 4.5 (± 2.7) | 5.0 (± 4.1) | 5.3 (± 4.5) | ||||
In a Word document, the result would be the following. Note the page number is indicated in the top row of the table. The code for this example is available in the flextable gallery here.
‘tabulator’ benefits for all flextable grammar and can build complex tables made with graphics and text:
Subset of original dataset | ||||||||||
cut | color | I1 | SI1 | VS2 | ||||||
y stats | density | y stats | density | y stats | density | |||||
Good | D | 3.5 (± 2.2) |
| 3.0 (± 2.8) |
| 3.6 (± 3.4) |
| |||
E | 4.4 (± 2.5) |
| 3.2 (± 3.1) |
| 3.8 (± 3.3) |
| ||||
F | 2.6 (± 1.9) |
| 3.3 (± 3.0) |
| 3.8 (± 3.2) |
| ||||
G | 3.2 (± 2.0) |
| 4.1 (± 3.9) |
| 4.1 (± 3.3) |
| ||||
H | 3.8 (± 2.2) |
| 4.2 (± 3.8) |
| 4.4 (± 4.2) |
| ||||
I | 4.2 (± 2.9) |
| 4.7 (± 4.5) |
| 6.0 (± 5.1) |
| ||||
J | 3.8 (± 2.1) |
| 4.6 (± 3.9) |
| 4.8 (± 3.6) |
| ||||
Very Good | D | 2.6 (± 0.8) |
| 3.2 (± 2.9) |
| 3.1 (± 3.3) |
| |||
E | 3.4 (± 2.2) |
| 3.2 (± 3.1) |
| 3.3 (± 3.5) |
| ||||
F | 4.3 (± 2.6) |
| 3.6 (± 3.2) |
| 4.0 (± 3.8) |
| ||||
G | 3.2 (± 2.1) |
| 3.5 (± 3.6) |
| 4.4 (± 4.0) |
| ||||
H | 5.3 (± 2.5) |
| 4.9 (± 4.4) |
| 4.6 (± 4.0) |
| ||||
I | 6.0 (± 4.9) |
| 5.2 (± 4.5) |
| 5.8 (± 5.1) |
| ||||
J | 4.5 (± 2.7) |
| 5.0 (± 4.1) |
| 5.3 (± 4.5) |
| ||||


Summarizor for table summary
Function summarizor() is an utility function that prepare
a numerical summary for each variables of a dataset, eventually
by groups. It is supposed to be used as argument of tabulator().
variable | stat | nonchilled | chilled | Overall | ||||||
Est. | N | Est. | N | Est. | N | |||||
Type | Quebec | 21 (50.0 %) | 21 (50.0 %) | 42 (50.0 %) | ||||||
Mississippi | 21 (50.0 %) | 21 (50.0 %) | 42 (50.0 %) | |||||||
Missing | 0 (0.0 %) | 0 (0.0 %) | 0 (0.0 %) | |||||||
conc | Min. | 95.0 | 95.0 | 95.0 | ||||||
1st Qu. | 175.0 | 175.0 | 175.0 | |||||||
Mean | 435.0 | 435.0 | 435.0 | |||||||
Median | 350.0 | 350.0 | 350.0 | |||||||
3rd Qu. | 675.0 | 675.0 | 675.0 | |||||||
Max. | 1 000.0 | 1 000.0 | 1 000.0 | |||||||
Missing | 0 (0.0 %) | 0 (0.0 %) | 0 (0.0 %) | |||||||
uptake | Min. | 10.6 | 7.7 | 7.7 | ||||||
1st Qu. | 26.5 | 14.5 | 17.9 | |||||||
Mean | 30.6 | 23.8 | 27.2 | |||||||
Median | 31.3 | 19.7 | 28.3 | |||||||
3rd Qu. | 38.7 | 34.9 | 37.1 | |||||||
Max. | 45.5 | 42.4 | 45.5 | |||||||
Missing | 0 (0.0 %) | 0 (0.0 %) | 0 (0.0 %) | |||||||
The code for this example is available in the flextable gallery here.
Automating flextable printing
flextable provides two new functions dedicated to ‘R Markdown’ that turn automatically data.frame and models to flextable.
data.frames as flextables
We brought a code that we were using for our trainings that
allows to display data.frame as flextables inside R Markdown documents. We
tried to mimic the output of ‘data.table’ and ‘tibble’ by displaying
just the first few rows and the type of the columns. To take advantage of
this feature, we need to call the use_df_printer() function and voila!
use_df_printer()
airqualityOzone | Solar.R | Wind | Temp | Month | Day |
integer | integer | numeric | integer | integer | integer |
41 | 190 | 7.4 | 67 | 5 | 1 |
36 | 118 | 8.0 | 72 | 5 | 2 |
12 | 149 | 12.6 | 74 | 5 | 3 |
18 | 313 | 11.5 | 62 | 5 | 4 |
14.3 | 56 | 5 | 5 | ||
28 | 14.9 | 66 | 5 | 6 | |
23 | 299 | 8.6 | 65 | 5 | 7 |
19 | 99 | 13.8 | 59 | 5 | 8 |
8 | 19 | 20.1 | 61 | 5 | 9 |
194 | 8.6 | 69 | 5 | 10 | |
n: 153 | |||||
Models as flextables
We have implemented the reporting of models into flextable,
the function as_flextable() is doing the transformation.
For now, the following models are supported: gam, lm, glm,
glmmTMB, glmmadmb, htest, kmeans, pam, lme, gls, merMod,
nlme and brmsfit.
This is an example made with a lme model:
library(nlme)
m1 <- lme(distance ~ age, data = Orthodont)
ft <- as_flextable(m1)
ftgroup | Estimate | Standard Error | df | statistic | p-value | ||
Fixed effects | |||||||
(Intercept) | 16.761 | 0.775 | 80 | 21.620 | 0.0000 | *** | |
age | 0.660 | 0.071 | 80 | 9.265 | 0.0000 | *** | |
Random effects | |||||||
Subject | sd_(Intercept) | 2.327 | |||||
Subject | cor_age.(Intercept) | -0.609 | |||||
Subject | sd_age | 0.226 | |||||
Residual | sd_Observation | 1.310 | |||||
Signif. codes: 0 <= '***' < 0.001 < '**' < 0.01 < '*' < 0.05 | |||||||
square root of the estimated residual variance: 1.3 | |||||||
data's log-likelihood under the model: -221.3 | |||||||
Akaike Information Criterion: 454.6 | |||||||
Bayesian Information Criterion: 470.6 | |||||||
In a R Markdown document, it is possible to automate the printing of models
as flextable by using the function use_model_printer().
This is an example made with a kmean clustering:
use_model_printer()
kmeans(scale(mtcars[1:7]), 5)variable | 1 | 2 | 3 | 4 | 5 | |||||
withinss | 4.1 | 0.7 | 10.6 | 3.9 | 23.9 | |||||
size | 5 | 3 | 9 | 4 | 11 | |||||
mpg* | -0.0582 | -1.3701 | -0.4391 | -0.9110 | 1.0906 | |||||
cyl* | -0.1050 | 1.0149 | 0.7660 | 1.0149 | -1.2249 | |||||
disp* | -0.5703 | 1.8284 | 0.5522 | 0.8857 | -1.0133 | |||||
hp* | -0.2696 | 1.0207 | 0.1374 | 1.8313 | -0.9342 | |||||
drat* | 0.4777 | -1.0160 | -1.0763 | 0.1467 | 0.8872 | |||||
wt* | -0.1924 | 2.1691 | 0.4020 | 0.3273 | -0.9520 | |||||
qsec* | -0.3429 | -0.0609 | 0.0162 | -1.5452 | 0.7211 | |||||
(*) Centers | ||||||||||
Total sum of squares: 217.0 | ||||||||||
Total within-cluster sum of squares: 43.2 | ||||||||||
Total between-cluster sum of squares: 173.8 | ||||||||||
BSS/TSS ratio: 80.1% | ||||||||||
Number of iterations: 3 | ||||||||||
Separate column names into multiple rows
You can now separate collapsed column names into multiple rows with
function separate_header(). This makes reporting aggregations
calculated with ‘dplyr’ or ‘data.table’ easy.
In the following example we aggregate the famous ‘penguins’ table.
species | island | bill_length_avg | bill_length_sd | bill_depth_avg | bill_depth_sd | flipper_length_avg | flipper_length_sd |
factor | factor | numeric | numeric | numeric | numeric | numeric | numeric |
Adelie | Biscoe | 39.0 | 2.5 | 18.4 | 1.2 | 188.8 | 6.7 |
Adelie | Dream | 38.5 | 2.5 | 18.3 | 1.1 | 189.7 | 6.6 |
Adelie | Torgersen | 39.0 | 3.0 | 18.4 | 1.3 | 191.2 | 6.2 |
Chinstrap | Dream | 48.8 | 3.3 | 18.4 | 1.1 | 195.8 | 7.1 |
Gentoo | Biscoe | 47.5 | 3.1 | 15.0 | 1.0 | 217.2 | 6.5 |
Without any intermediate manipulation, we create the ‘flextable’
and restructure header labels by using separate_header().
ft <- dat |>
  flextable() |>
  separate_header() |>
  autofit()
ftspecies | island | bill | flipper | ||||
length | depth | length | |||||
avg | sd | avg | sd | avg | sd | ||
Adelie | Biscoe | 38.97500 | 2.480916 | 18.37045 | 1.1888199 | 188.7955 | 6.729247 |
Adelie | Dream | 38.50179 | 2.465359 | 18.25179 | 1.1336171 | 189.7321 | 6.585083 |
Adelie | Torgersen | 38.95098 | 3.025318 | 18.42941 | 1.3394468 | 191.1961 | 6.232238 |
Chinstrap | Dream | 48.83382 | 3.339256 | 18.42059 | 1.1353951 | 195.8235 | 7.131894 |
Gentoo | Biscoe | 47.50488 | 3.081857 | 14.98211 | 0.9812198 | 217.1870 | 6.484976 |
It’s then quite easy to customize it and produce a flextable as below:
species | island | bill | flipper | ||||
length | depth | length | |||||
avg1 | sd2 | avg1 | sd2 | avg1 | sd2 | ||
Adelie | Biscoe | 38.98 | 2.48 | 18.37 | 1.19 | 188.80 | 6.73 |
Dream | 38.50 | 2.47 | 18.25 | 1.13 | 189.73 | 6.59 | |
Torgersen | 38.95 | 3.03 | 18.43 | 1.34 | 191.20 | 6.23 | |
Chinstrap | Dream | 48.83 | 3.34 | 18.42 | 1.14 | 195.82 | 7.13 |
Gentoo | Biscoe | 47.50 | 3.08 | 14.98 | 0.98 | 217.19 | 6.48 |
1Arithmetic Mean | |||||||
2Standard Deviation | |||||||
The code for this example is available in the flextable gallery here.
GitHub Discussions
Let us know about your issues, questions and feedbacks in ‘GitHub Discussions’ now available in the Github page of ‘flextable’: https://github.com/davidgohel/flextable/discussions.