Classement de joueurs de tennis
Packages
library(flextable)
library(dplyr)
set_flextable_defaults(big.mark=" ")
Data
Ce jeu de données a été créé à la main. Il représente un classement des joueurs de tennis. Il comprend en plus de quelques statistiques les noms des images représentant le drapeau du pays d’origine du joueur ainsi qu’une photo du joueur.
tennis_players <-
  data.frame(
    Rank = 1:10,
    Player = c(
      "Roger Federer", "Lleyton Hewitt", "Feliciano Lopez", "Ivo Karlovic", "Andy Murray",
      "Pete Sampras", "Greg Rusedski", "Tim Henman", "Novak Djokovic", "Andy Roddick"
    ),
    Percentage = c(92.63, 85.29, 89.86, 94.87, 88.89, 92.66, 90.33, 83.77, 89.12, 92.76),
    `Games Won` = c(2739L, 1740L, 1684L, 1645L, 1528L, 1478L, 1476L, 1461L, 1442L, 1410L),
    `Total Games` = c(2957L, 2040L, 1874L, 1734L, 1719L, 1595L, 1634L, 1744L, 1618L, 1520L),
    Matches = c(205L, 149L, 122L, 113L, 121L, 105L, 116L, 110L, 106L, 103L),
    head = c(
      "federer_head.png", "hewitt_head.png", "lopez_head.png", "karlovic_head.png",
      "murray_head.png", "sampras_head.png", "rusedski_head.png", "henman_head.png",
      "djokovic_head.png", "roddick_head.png"
    ),
    flag = c(
      "sui.png", "aus.png", "esp.png", "cro.png", "gbr.png", "usa.png",
      "gbr.png", "gbr.png", "srb.png", "usa.png"
    ),
    stringsAsFactors = FALSE
  ) |>
  mutate(
    head = file.path("players", head),
    flag = file.path("flags", flag)
  )
tennis_players
##    Rank          Player Percentage Games.Won Total.Games Matches
## 1     1   Roger Federer      92.63      2739        2957     205
## 2     2  Lleyton Hewitt      85.29      1740        2040     149
## 3     3 Feliciano Lopez      89.86      1684        1874     122
## 4     4    Ivo Karlovic      94.87      1645        1734     113
## 5     5     Andy Murray      88.89      1528        1719     121
## 6     6    Pete Sampras      92.66      1478        1595     105
## 7     7   Greg Rusedski      90.33      1476        1634     116
## 8     8      Tim Henman      83.77      1461        1744     110
## 9     9  Novak Djokovic      89.12      1442        1618     106
## 10   10    Andy Roddick      92.76      1410        1520     103
##                         head          flag
## 1   players/federer_head.png flags/sui.png
## 2    players/hewitt_head.png flags/aus.png
## 3     players/lopez_head.png flags/esp.png
## 4  players/karlovic_head.png flags/cro.png
## 5    players/murray_head.png flags/gbr.png
## 6   players/sampras_head.png flags/usa.png
## 7  players/rusedski_head.png flags/gbr.png
## 8    players/henman_head.png flags/gbr.png
## 9  players/djokovic_head.png flags/srb.png
## 10  players/roddick_head.png flags/usa.png
Images
Les images listées dans le data.frame présenté ci-dessus sont disponibles dans deux répertoires du projet courant.
Les images des joueurs sont dans le répertoire “players”
list.files("players")
##  [1] "djokovic_head.png" "federer_head.png"  "henman_head.png"
##  [4] "hewitt_head.png"   "karlovic_head.png" "lopez_head.png"
##  [7] "murray_head.png"   "roddick_head.png"  "rusedski_head.png"
## [10] "sampras_head.png"
Les drapeaux sont dans le répertoire “flags”.
list.files("flags")
## [1] "aus.png" "cro.png" "esp.png" "gbr.png" "srb.png" "sui.png" "usa.png"
La composition du tableau
On va d’abord créer un tableau avec le jeu de données tennis_players. On
ne va pas afficher toutes les colonnes.
ft <- flextable(tennis_players,
  col_keys = c("flag",
    "Rank", "Player", "Percentage",
    "Games.Won", "Total.Games", "Matches"
  )
)
ftflag | Rank | Player | Percentage | Games.Won | Total.Games | Matches |
flags/sui.png | 1 | Roger Federer | 92.63 | 2 739 | 2 957 | 205 |
flags/aus.png | 2 | Lleyton Hewitt | 85.29 | 1 740 | 2 040 | 149 |
flags/esp.png | 3 | Feliciano Lopez | 89.86 | 1 684 | 1 874 | 122 |
flags/cro.png | 4 | Ivo Karlovic | 94.87 | 1 645 | 1 734 | 113 |
flags/gbr.png | 5 | Andy Murray | 88.89 | 1 528 | 1 719 | 121 |
flags/usa.png | 6 | Pete Sampras | 92.66 | 1 478 | 1 595 | 105 |
flags/gbr.png | 7 | Greg Rusedski | 90.33 | 1 476 | 1 634 | 116 |
flags/gbr.png | 8 | Tim Henman | 83.77 | 1 461 | 1 744 | 110 |
flags/srb.png | 9 | Novak Djokovic | 89.12 | 1 442 | 1 618 | 106 |
flags/usa.png | 10 | Andy Roddick | 92.76 | 1 410 | 1 520 | 103 |
Le drapeau du pays du joueur est imprimé dans la colonne “Country”.
ft <- compose(ft,
    j = "flag",
    value = as_paragraph(
      as_image(src = flag, width = .5, height = 0.33)
    )
  ) |>
  set_header_labels(flag = "Country")

ftCountry | Rank | Player | Percentage | Games.Won | Total.Games | Matches |
| 1 | Roger Federer | 92.63 | 2 739 | 2 957 | 205 |
| 2 | Lleyton Hewitt | 85.29 | 1 740 | 2 040 | 149 |
| 3 | Feliciano Lopez | 89.86 | 1 684 | 1 874 | 122 |
| 4 | Ivo Karlovic | 94.87 | 1 645 | 1 734 | 113 |
| 5 | Andy Murray | 88.89 | 1 528 | 1 719 | 121 |
| 6 | Pete Sampras | 92.66 | 1 478 | 1 595 | 105 |
| 7 | Greg Rusedski | 90.33 | 1 476 | 1 634 | 116 |
| 8 | Tim Henman | 83.77 | 1 461 | 1 744 | 110 |
| 9 | Novak Djokovic | 89.12 | 1 442 | 1 618 | 106 |
| 10 | Andy Roddick | 92.76 | 1 410 | 1 520 | 103 |


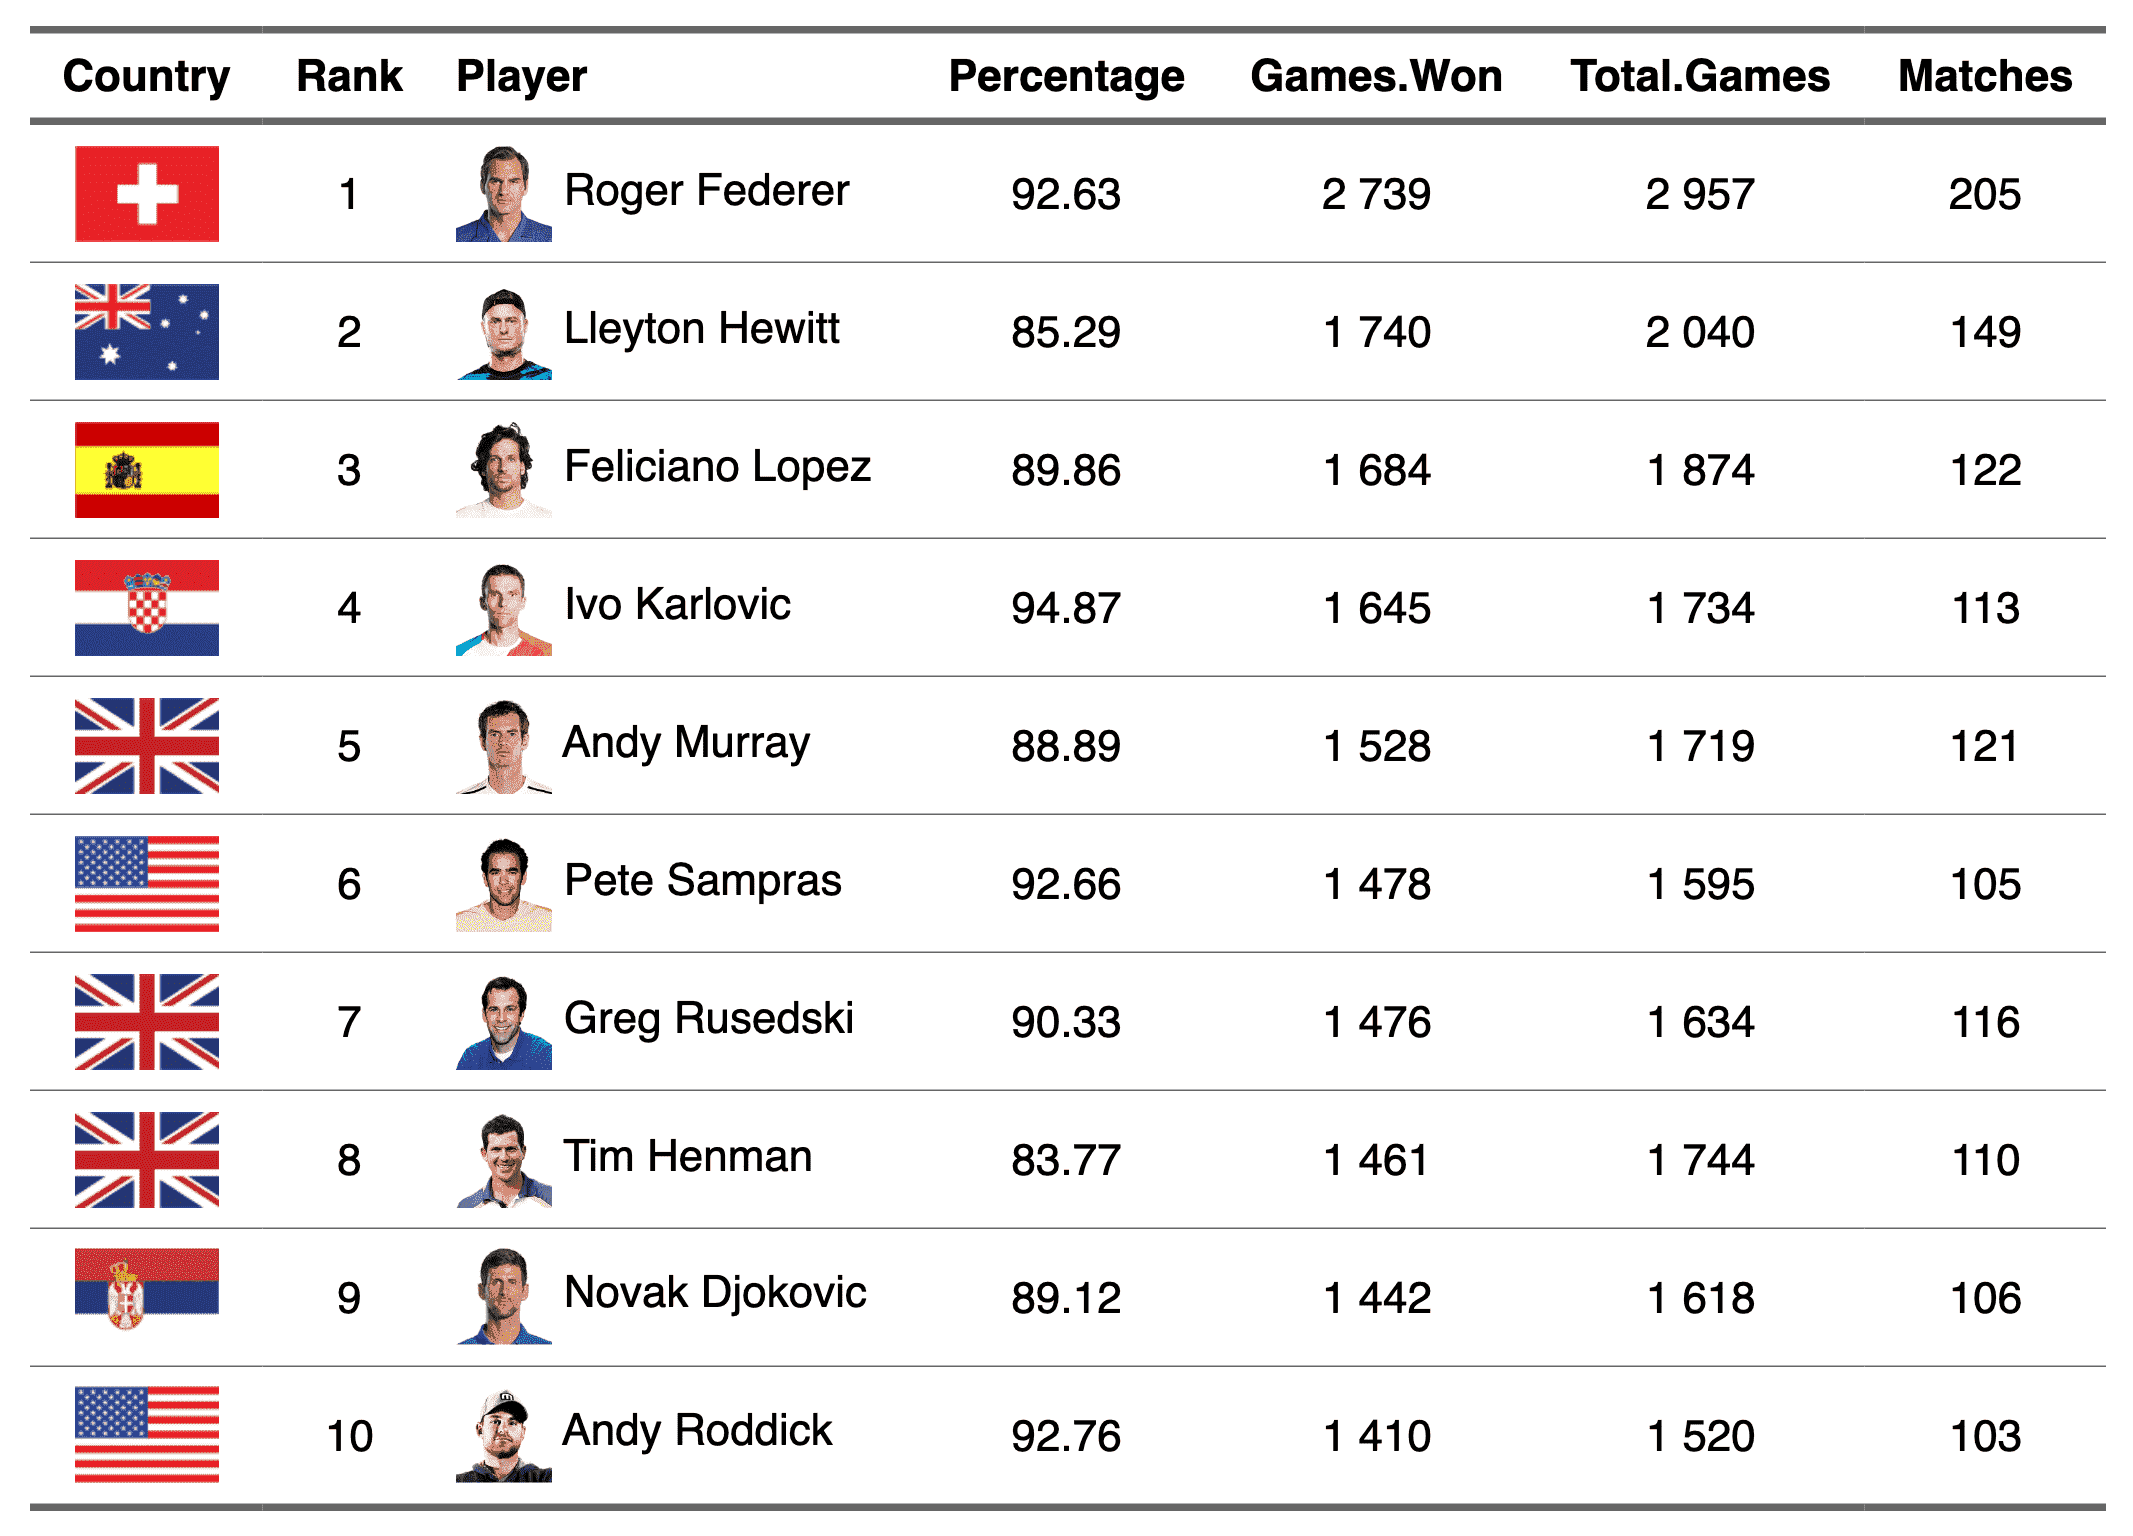
Maintenant on va ré-écrire le contenu de la colonne “Player” en concaténant le portrait du joueur et son nom.
ft <- compose(ft,
    j = "Player",
    value = as_paragraph(
      as_image(src = head, width = .33, height = 0.33),
      " ",
      as_chunk(x = Player)
    )
  )
ftCountry | Rank | Player | Percentage | Games.Won | Total.Games | Matches |
| 1 |
| 92.63 | 2 739 | 2 957 | 205 |
| 2 |
| 85.29 | 1 740 | 2 040 | 149 |
| 3 |
| 89.86 | 1 684 | 1 874 | 122 |
| 4 |
| 94.87 | 1 645 | 1 734 | 113 |
| 5 |
| 88.89 | 1 528 | 1 719 | 121 |
| 6 |
| 92.66 | 1 478 | 1 595 | 105 |
| 7 |
| 90.33 | 1 476 | 1 634 | 116 |
| 8 |
| 83.77 | 1 461 | 1 744 | 110 |
| 9 |
| 89.12 | 1 442 | 1 618 | 106 |
| 10 |
| 92.76 | 1 410 | 1 520 | 103 |


Il reste à appliquer une fonction theme.
ft <- theme_vanilla(ft) |>
  align(align = "center", part = "all") |>
  align(align = "left", j = "Player", part = "all") |>
  autofit(add_w = .1, unit = "cm")
ftCountry | Rank | Player | Percentage | Games.Won | Total.Games | Matches |
| 1 |
| 92.63 | 2 739 | 2 957 | 205 |
| 2 |
| 85.29 | 1 740 | 2 040 | 149 |
| 3 |
| 89.86 | 1 684 | 1 874 | 122 |
| 4 |
| 94.87 | 1 645 | 1 734 | 113 |
| 5 |
| 88.89 | 1 528 | 1 719 | 121 |
| 6 |
| 92.66 | 1 478 | 1 595 | 105 |
| 7 |
| 90.33 | 1 476 | 1 634 | 116 |
| 8 |
| 83.77 | 1 461 | 1 744 | 110 |
| 9 |
| 89.12 | 1 442 | 1 618 | 106 |
| 10 |
| 92.76 | 1 410 | 1 520 | 103 |