Table with density lines
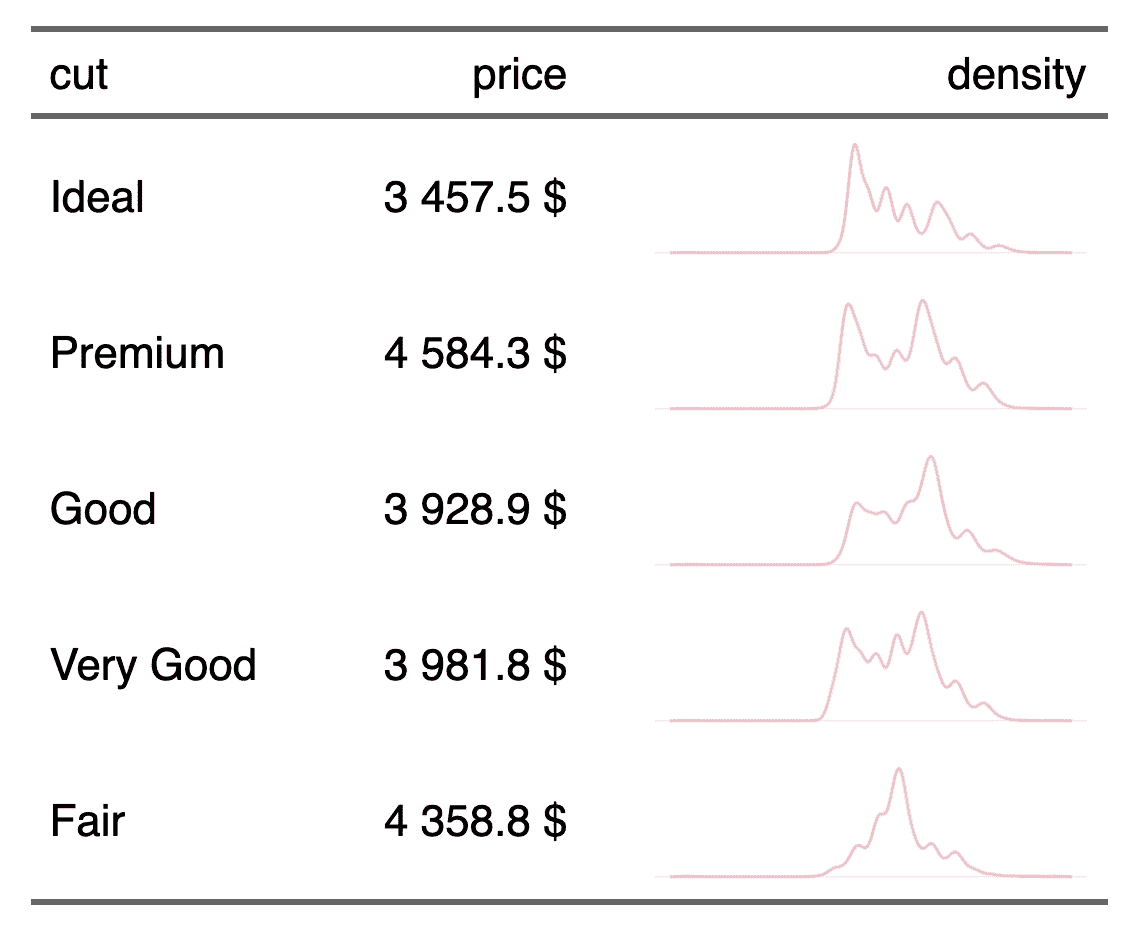
In this example, we create a flextable that represents aggregations and density curves together.
In this example, we create a flextable that represents aggregations and density curves together.