The package flextable is existing since mid 2016 and I did not made any
communication about it; obviously if I wrote it, I’d like it to be used by
R users! That post is an attempt to fix that.

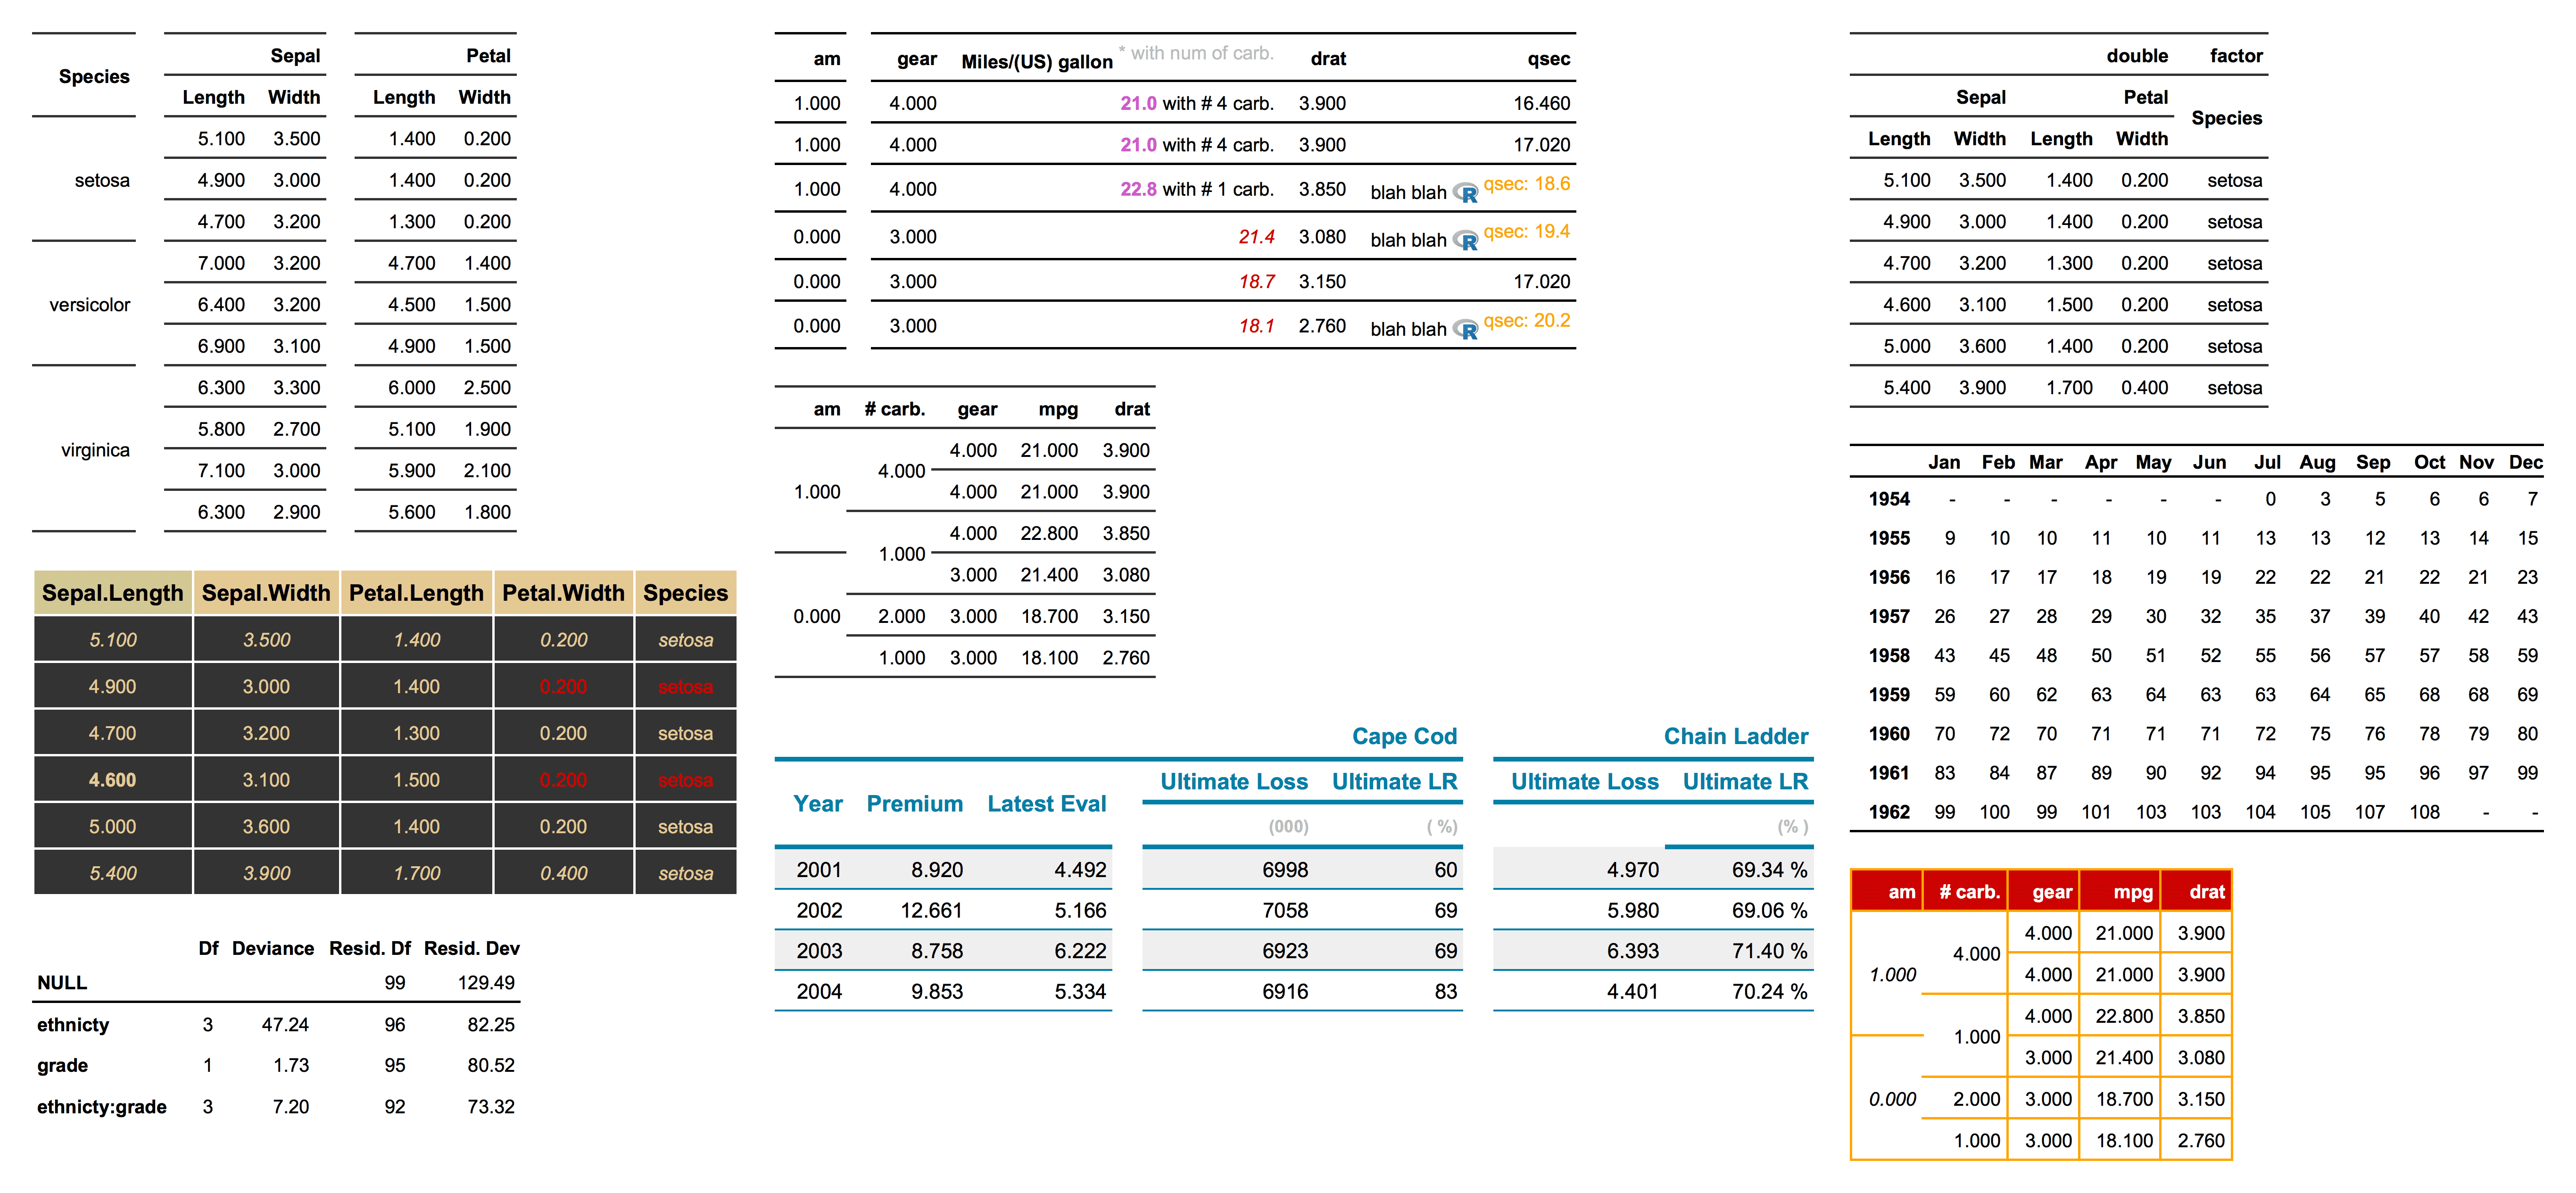
The flextable package makes it simpler to create
tables for reporting purposes. The goal of the package is to provide a set of functions that can
be used to design and format tabular reporting.
It’s been originally written in order to provide an alternative to ReporteRs::FlexTable objects
that are not supported by package officer.
What the flextable package does
It lets customize tables, their formats and their contents. Formatting can be done on cells, paragraphs and text. It also lets you to insert headers and footer rows with eventually merged cells.
Common operations can be made with simple functions, i.e. use
bold() to make a table selection bold, use align() to set alignment,
merge_at() to merge contiguous cells, etc. Conditional formatting is
possible with each of these functions.
Supported outputs
These objects can be rendered with R markdown documents. There is a knitr::knit_print method
for HTML output and for Word output (thanks to Maxim Nazarov). Note that you will need
pandoc >= 2.0.0 if you want to use Word output.
These objects can also be used with package officer and can be rendered into Word and PowerPoint documents
(and Excel when I will find time and motivation for it).
xtable
A work started to support outputs from package xtable. It make statistical reporting easier
for those used to work with xtable.
For now, only
xtableobjects are supported butxtableListwill also be supported later.
library(xtable)
library(flextable)
temp.ts <- ts(cumsum(1 + round(rnorm(100), 0)),
  start = c(1954, 7), frequency = 12)
ft <- xtable_to_flextable(x = xtable(temp.ts, digits = 0),
  NA.string = "-")
ftJan | Feb | Mar | Apr | May | Jun | Jul | Aug | Sep | Oct | Nov | Dec | |
1954 | 0.0 | 1.0 | 1.0 | 2.0 | 4.0 | 5.0 | ||||||
1955 | 5.0 | 7.0 | 5.0 | 7.0 | 7.0 | 8.0 | 9.0 | 10.0 | 11.0 | 11.0 | 12.0 | 13.0 |
1956 | 14.0 | 16.0 | 17.0 | 18.0 | 19.0 | 20.0 | 20.0 | 21.0 | 22.0 | 23.0 | 24.0 | 27.0 |
1957 | 27.0 | 29.0 | 31.0 | 33.0 | 35.0 | 36.0 | 38.0 | 41.0 | 41.0 | 42.0 | 45.0 | 45.0 |
1958 | 47.0 | 49.0 | 50.0 | 50.0 | 49.0 | 49.0 | 50.0 | 50.0 | 51.0 | 54.0 | 56.0 | 56.0 |
1959 | 57.0 | 59.0 | 59.0 | 59.0 | 60.0 | 61.0 | 61.0 | 63.0 | 65.0 | 64.0 | 65.0 | 66.0 |
1960 | 66.0 | 67.0 | 68.0 | 69.0 | 70.0 | 73.0 | 75.0 | 75.0 | 77.0 | 80.0 | 79.0 | 80.0 |
1961 | 80.0 | 80.0 | 81.0 | 82.0 | 83.0 | 84.0 | 86.0 | 85.0 | 85.0 | 86.0 | 90.0 | 94.0 |
1962 | 94.0 | 95.0 | 94.0 | 95.0 | 96.0 | 96.0 | 95.0 | 96.0 | 98.0 | 99.0 |
Preview
the function print() makes it easier to view the flextable inside all
supported format.
By default, the print method display the flextable in an HTML page, if you are running R with RStudio, the flextable is displayed in the Viewer as an HTML table.
This can be change with argument preview. The document will be opened
with the application associated to the file extension (Word or PowerPoint).
This will not work on a Web server, i.e. RStudio Server.
library(flextable)

ft <- regulartable(head(iris))
ft <- theme_vanilla(ft)
ft <- width(ft, width = 1)
ftSepal.Length | Sepal.Width | Petal.Length | Petal.Width | Species |
5.1 | 3.5 | 1.4 | 0.2 | setosa |
4.9 | 3.0 | 1.4 | 0.2 | setosa |
4.7 | 3.2 | 1.3 | 0.2 | setosa |
4.6 | 3.1 | 1.5 | 0.2 | setosa |
5.0 | 3.6 | 1.4 | 0.2 | setosa |
5.4 | 3.9 | 1.7 | 0.4 | setosa |
print(ft, preview = "log")#> a flextable object.
#> col_keys: `Sepal.Length`, `Sepal.Width`, `Petal.Length`, `Petal.Width`, `Species`
#> header has 1 row(s)
#> body has 6 row(s)
#> original dataset sample:
#> Sepal.Length Sepal.Width Petal.Length Petal.Width Species
#> 1 5.1 3.5 1.4 0.2 setosa
#> 2 4.9 3.0 1.4 0.2 setosa
#> 3 4.7 3.2 1.3 0.2 setosa
#> 4 4.6 3.1 1.5 0.2 setosa
#> 5 5.0 3.6 1.4 0.2 setosaprint(ft, preview = "docx")
print(ft, preview = "pptx")Detailed example
Let’s first create a data.frame example from a sample of mtcars. We will
use it as data source for our reporting table.
library(tibble)
library(magrittr)

dataset <- mtcars %>%
  rownames_to_column(var = "car_name") %>%
  head() %T>%
  print()
#> car_name mpg cyl disp hp drat wt qsec vs am gear carb
#> 1 Mazda RX4 21.0 6 160 110 3.90 2.620 16.46 0 1 4 4
#> 2 Mazda RX4 Wag 21.0 6 160 110 3.90 2.875 17.02 0 1 4 4
#> 3 Datsun 710 22.8 4 108 93 3.85 2.320 18.61 1 1 4 1
#> 4 Hornet 4 Drive 21.4 6 258 110 3.08 3.215 19.44 1 0 3 1
#> 5 Hornet Sportabout 18.7 8 360 175 3.15 3.440 17.02 0 0 3 2
#> 6 Valiant 18.1 6 225 105 2.76 3.460 20.22 1 0 3 1Now let’s use flextable API:
myft <- regulartable( dataset,
  col_keys = c("car_name", "am", "carb", "gear", "blank", "mpg", "drat" )) %>%
  theme_vanilla() %>%
  width(j = c("am", "carb", "gear", "mpg", "drat" ), width = 1) %>%
  width(j = 1, width = 2)
myftcar_name | am | carb | gear | mpg | drat | |
Mazda RX4 | 1 | 4 | 4 | 21.0 | 3.90 | |
Mazda RX4 Wag | 1 | 4 | 4 | 21.0 | 3.90 | |
Datsun 710 | 1 | 1 | 4 | 22.8 | 3.85 | |
Hornet 4 Drive | 0 | 1 | 3 | 21.4 | 3.08 | |
Hornet Sportabout | 0 | 2 | 3 | 18.7 | 3.15 | |
Valiant | 0 | 1 | 3 | 18.1 | 2.76 |
We’ve just created a simple table. Let’s customize printed values.
# Change labels
myft <- myft %>%
  set_header_labels(
    car_name = "Car name", am = "Transmission", carb = "# carburetors",
    gear = "# forward gears", mpg = "Miles/(US) gallon", drat = "Rear axle ratio")
myft <- myft %>%
  add_header(mpg = "Some measures") %>%
  merge_at(i = 1, j = c("mpg", "drat"), part = "header") %>%
  set_formatter(
    am = function(x) ifelse( x < 1, "automatic", "manual"),
    carb = function(x) sprintf("%.0f", x),
    gear = function(x) sprintf("%.0f", x)
    )
myftSome measures | ||||||
Car name | Transmission | # carburetors | # forward gears | Miles/(US) gallon | Rear axle ratio | |
Mazda RX4 | manual | 4 | 4 | 21.0 | 3.90 | |
Mazda RX4 Wag | manual | 4 | 4 | 21.0 | 3.90 | |
Datsun 710 | manual | 1 | 4 | 22.8 | 3.85 | |
Hornet 4 Drive | automatic | 1 | 3 | 21.4 | 3.08 | |
Hornet Sportabout | automatic | 2 | 3 | 18.7 | 3.15 | |
Valiant | automatic | 1 | 3 | 18.1 | 2.76 | |
And now let’s add some formattings.
myft <- myft %>%
  bold(i = 3, bold = TRUE) %>% bold(j = 3, bold = TRUE) %>%
  color(j = 3, color = "#4790b5") %>% color(i = 3, color = "#d24625") %>%
  align(j = 3:6, align = "center", part = "all") %>%
  empty_blanks()
myftSome measures | ||||||
Car name | Transmission | # carburetors | # forward gears | Miles/(US) gallon | Rear axle ratio | |
Mazda RX4 | manual | 4 | 4 | 21.0 | 3.90 | |
Mazda RX4 Wag | manual | 4 | 4 | 21.0 | 3.90 | |
Datsun 710 | manual | 1 | 4 | 22.8 | 3.85 | |
Hornet 4 Drive | automatic | 1 | 3 | 21.4 | 3.08 | |
Hornet Sportabout | automatic | 2 | 3 | 18.7 | 3.15 | |
Valiant | automatic | 1 | 3 | 18.1 | 2.76 | |
Finally, adjust widths and heights:
myft <- autofit(myft)
myftSome measures | ||||||
Car name | Transmission | # carburetors | # forward gears | Miles/(US) gallon | Rear axle ratio | |
Mazda RX4 | manual | 4 | 4 | 21.0 | 3.90 | |
Mazda RX4 Wag | manual | 4 | 4 | 21.0 | 3.90 | |
Datsun 710 | manual | 1 | 4 | 22.8 | 3.85 | |
Hornet 4 Drive | automatic | 1 | 3 | 21.4 | 3.08 | |
Hornet Sportabout | automatic | 2 | 3 | 18.7 | 3.15 | |
Valiant | automatic | 1 | 3 | 18.1 | 2.76 | |
With package officer
The following code is producing a PowerPoint document containing the flextable.
library(officer)
read_pptx() %>%
  add_slide(layout = "Title and Content", master = "Office Theme") %>%
  ph_with(myft, ph_location_type(type="body")) %>%
  print(target = "../../static/files/flextable_example_01.pptx")
Download file flextable_example_01.pptx - view with office web viewer
The following code is producing a Word document containing the flextable.
library(officer)
read_docx() %>%
  body_add_flextable(value = myft) %>%
  print(target = "../../static/files/flextable_example_01.docx")
Download file flextable_example_01.docx - view with office web viewer