6 Known issues and best practices
6.1 Managing Grouping with Interactive Aesthetics
Adding an interactive aesthetic like tooltip can sometimes alter the implicit grouping that ggplot2 performs automatically.
In these cases, you must explicitly specify the group aesthetic to ensure correct graph rendering by clearly defining the variables that determine the grouping.
mapping = ggplot2::aes(tooltip = .data_tooltip, group = interaction(factor1, factor2, ...))This precaution is necessary:
- ggplot2 automatically determines grouping based on the provided aesthetics
- Interactive aesthetics added by ggiraph can interfere with this logic
- Explicit
groupspecification prevents unexpected behavior and ensures predictable results
This illustration below demonstrates how adding the interactive tooltip aesthetic can disrupt ggplot2’s automatic group construction:
Left plot (z1): the
group = interaction(X, Group)is explicitly specified. ggplot2 correctly constructs groups based onX × Groupcombinations (A-G1, A-G2, B-G1, etc.), allowingposition_jitterdodgeto apply horizontal dodging according to these groups.Right plot (z2): without explicit
group, ggplot2 automatically generates groups including all discrete variables:X,Group, ANDtooltip. Since each point has a uniquetooltipvalue (paste(Y)), each point forms its own group, preventing dodging from working correctly.
library(patchwork)
set.seed(2)

data <- data.frame(
  X = sample(c("A", "B", "C"), 120, replace = TRUE),
  Y = rnorm(120),
  Group = sample(c("G1", "G2"), 120, replace = TRUE)
)

z1 <- ggplot(data, aes(x = X, y = Y, color = Group)) +
  geom_point_interactive(
    aes(tooltip = paste(Y), group = interaction(X, Group)),
    position = position_jitterdodge(jitter.width = 0, dodge.width = 0.8)) +
  labs(title = "correct graphic")

z2 <- ggplot(data, aes(x = X, y = Y, color = Group)) +
  geom_point_interactive(
    aes(tooltip = paste(Y)),
    position = position_jitterdodge(jitter.width = 0, dodge.width = 0.8)) +
  labs(title = "wrong graphic")

z1 + z2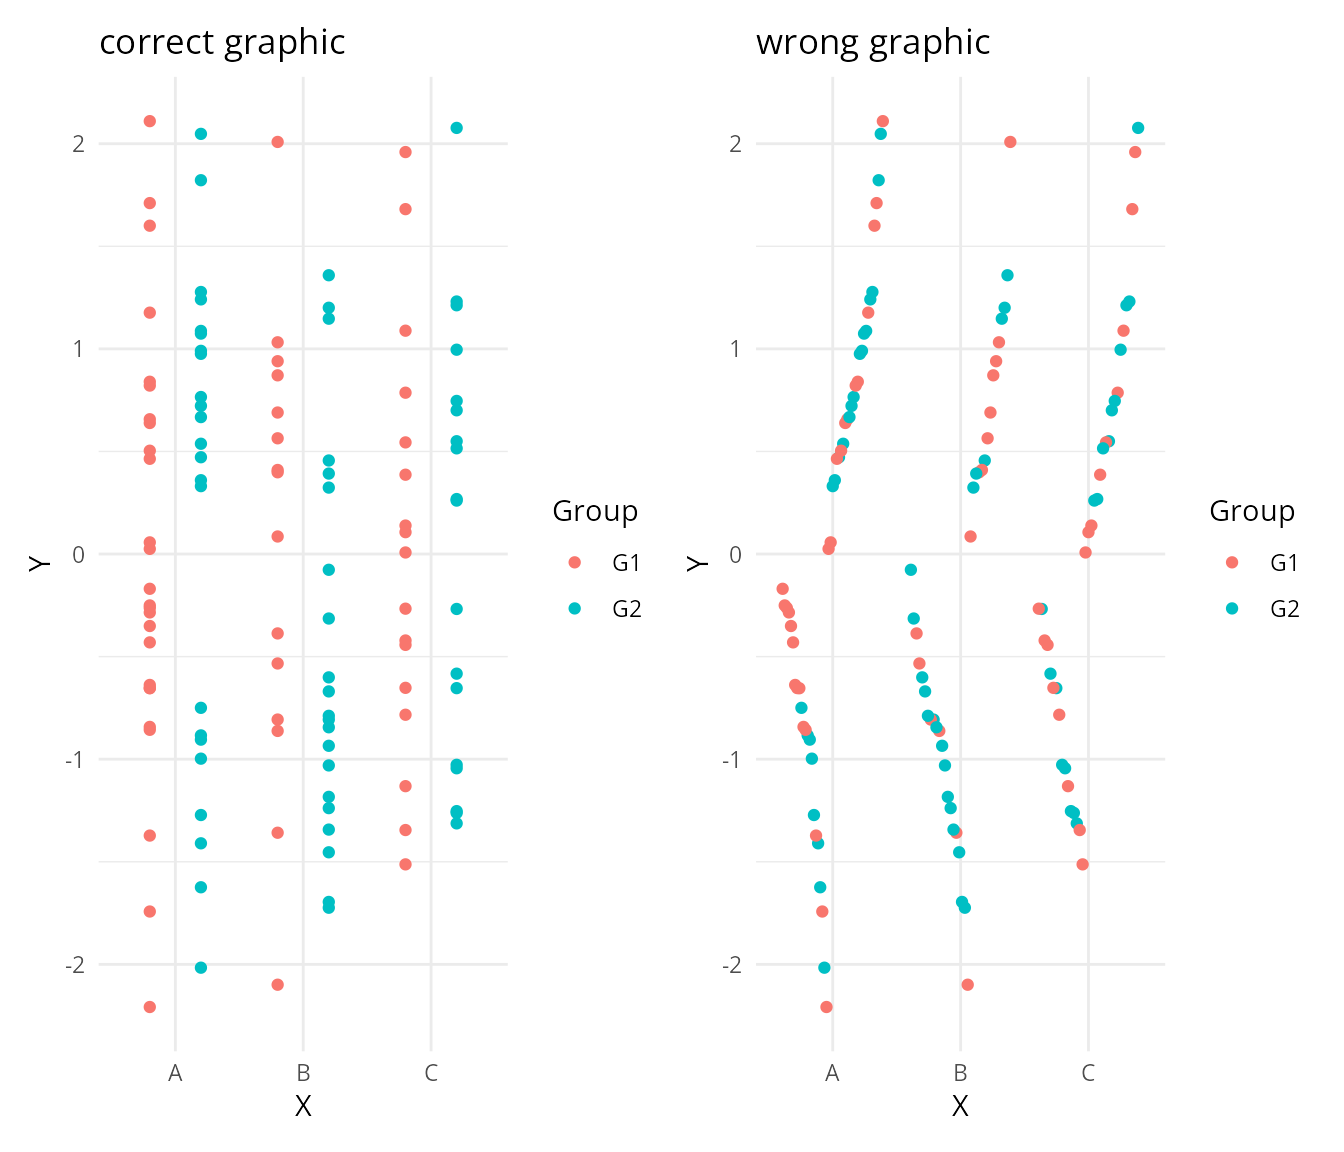
6.2 Interactive Line Hover Detection Issues
When using geom_line_interactive() or geom_path_interactive() in ggiraph, you might notice strange behavior: hover detection doesn’t work as expected on your lines.
- Hover triggered away from the line: Your cursor triggers the hover effect even when positioned far from the visible line
- No hover on the actual line: Conversely, placing your cursor directly on the line sometimes triggers an effect on another line
- Blocked elements: Other interactive elements (like points) located within areas “enclosed” by your lines become inaccessible
Try it yourself: Move your cursor around the plot - you’ll see that hover zones don’t match the visible lines.
library(ggplot2)
library(ggiraph)

ggchick <- ggplot(
  data = ChickWeight,
  mapping = aes(
    y = weight,
    x = Time,
    color = factor(Diet),
    data_id = Chick)
) +
  geom_point_interactive(hover_nearest = TRUE) +
  geom_line_interactive(aes(group = Chick))

girafe(ggobj = ggchick)
The system treats your lines as closed polygons instead of simple paths. This creates polygon-shaped detection zones that encompass the area enclosed by your line segments, rather than limiting detection to the actual line stroke.
There are workaround solutions to this issue:
- Disable
hover_nearest(partial solution). This option only partially solves the problem.
library(ggplot2)
library(ggiraph)

ggchick <- ggplot(
  data = ChickWeight,
  mapping = aes(
    y = weight,
    x = Time,
    color = factor(Diet),
    data_id = Chick)
) +
  geom_point_interactive(hover_nearest = FALSE) +
  geom_line_interactive(aes(group = Chick))

girafe(ggobj = ggchick)- Alternative: Use segments
For precise control, you can use geom_segment_interactive().
chick_weight_seg <- ChickWeight  |>
  as_tibble() |>
  arrange(Diet, Chick, Time) %>%
  group_by(Diet, Chick) %>%
  mutate(
    time_end = lead(Time),
    weight_end = lead(weight)
  ) %>%
  filter(!is.na(time_end))

ggchick <- ggplot(
  chick_weight_seg,
  mapping = aes(
    x = Time,
    y = weight,
    xend = time_end,
    yend = weight_end,
    data_id = Chick,
    tooltip = Diet,
    color = Diet
  )
) +
  geom_segment_interactive() +
  geom_point_interactive(hover_nearest = TRUE)

girafe(ggobj = ggchick, options = list(opts_sizing(rescale = TRUE)))